Excluding Auckland, property prices across New Zealand have seen spring lift - REINZ stats September 2021
Friday, 15 October 2021

Seven out of 16 regions reached new record median prices — the most since April 2021. Nine regional records were reached in September 2020, however, this month’s total number of records remains above average for a September month (REINZ).
The median house price for New Zealand excluding Auckland increased by 23.1% from $585,000 in September 2020 to a new record of $720,000.
Jen Baird, Chief Executive at REINZ says: “September was always going to be a month to watch as we assess the impact various COVID-19 Alert Levels have on the New Zealand property market. What the data shows, is that confidence remains high, buyer demand is still strong, and outside of Auckland, buyers will be pleased to see more property coming to the market. Prices are proving resilient, with some regions noting a decrease in the number of first home buyers, in part due to rising prices."
“Various levels of lockdown across New Zealand have influenced activity in the real estate market this month lending to mixed results. We expect to see a rise in activity as restrictions ease further, especially in Auckland. Demand suppression measures introduced this year, recent moves by the Reserve Bank to increase the OCR, and COVID-19 restrictions to real estate activity are creating headwinds for house prices and we can see that the pace of price rises has slowed over recent months,”
The seven regions that reached record median prices in September were:
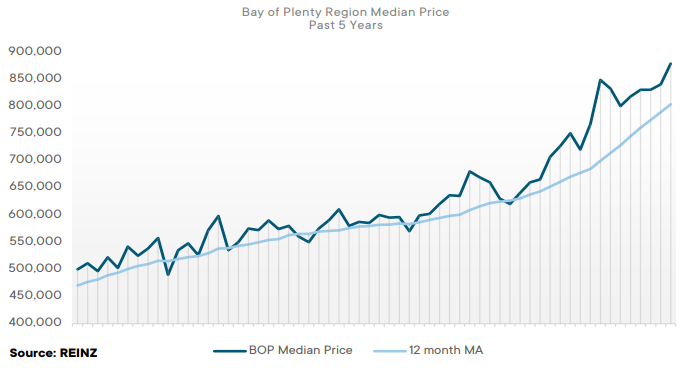
- Bay of Plenty: 31.6% increase from $707,000 in September 2020 to a new record of $878,000 in September 2021.
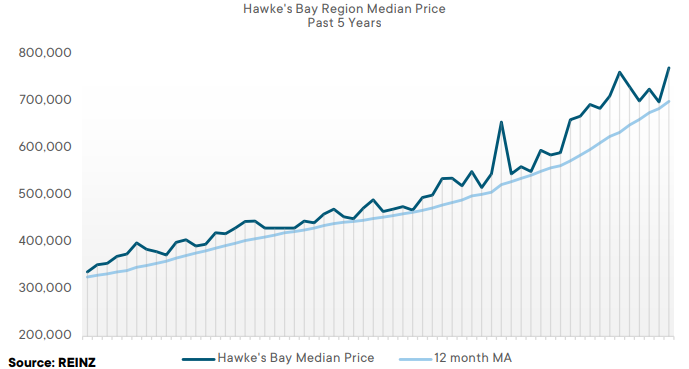
- Hawke’s Bay: 35.3% increase from $585,000 in September 2020 to a new record of $770,000 in September 2021.
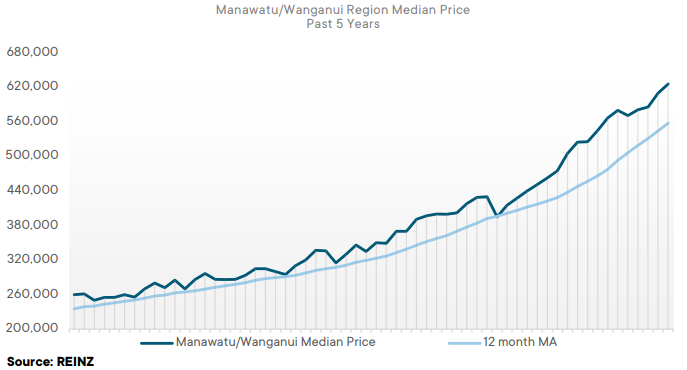
- Manawatu/Whanganui: 35.4% increase from $462,500 in September 2020 to a new record of $626,000 in September 2021.
- Tasman: 27.4% increase from $675,000 in September 2020 to a new record of $860,000 in September 2021.
- Nelson: 24.5% increase from $644,165 in September 2020 to a new record of $802,000 in September 2021.
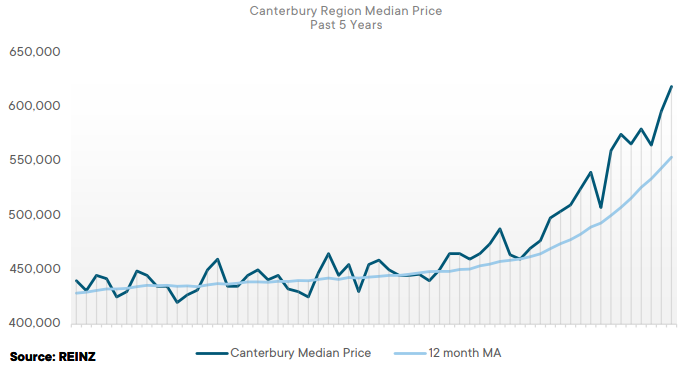
- Canterbury: 31.0% increase from $504,000 in September 2020 to a new record of $660,000 in September 2021.
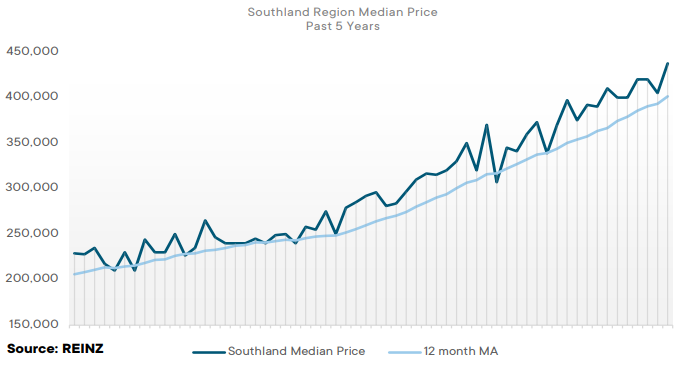
- Southland: 29.1% increase from $339,000 in September 2020 to a new record of $437,580 in September 2021.
Regional Analysis - Auckland
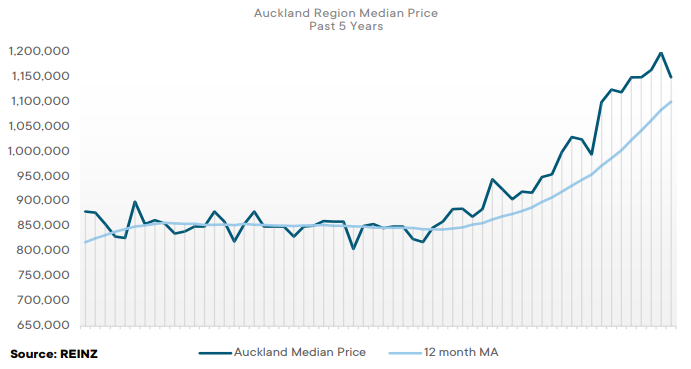
“Median prices in Auckland reached $1,150,000 up 20.4% from that of September 2020. The Papakura District reached a record median of $1,060,000, exceeding its previous record in August by 13.4%. The COVID-19 Alert Level 4 and 3 lockdowns have impacted listings with a -57.9% decrease from September last year, which may be due to hesitation and people waiting for lower alert levels before putting their property on the market.
Auckland also experienced its lowest September sales count ever and its lowest sales count in general since April 2020, with 1,338 properties sold. As most real estate functions continued remotely, Auckland saw an increase in online auctions; 31.4% of properties were sold by auction in September 2021, up from 27.0% in September 2020. Properties have been selling fast.
The median days to sell was 35 in September 2021 — the lowest median days to sell in September since 2007. There has been a decline in the numbers of first home buyers, with 83.2% of houses selling above the $750,000 price point.
Auckland has also seen a decrease in investor activity due to COVID-19 and new tax legislation in conjunction with a low level of stock and rising house prices. With the market showing some caution, many expect the usual spring activity to be delayed until Auckland is in Alert Level 2. Some expect an increase in Aucklanders wanting to live in provincial areas outside of the city due to the length of time spent in lockdown giving rise to considerations on whether living in another area of New Zealand is an attractive option.” (REINZ)
The current Days to Sell of 35 days is more than the 10-year average for September which is 34 days. There were 11 weeks of inventory in September 2021 which is 2 weeks less than the same time last year.
Regional Analysis - Northland
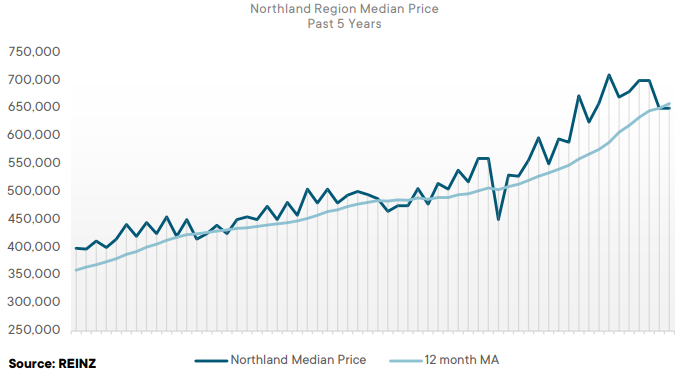
“Median house prices in Northland increased 18.2% year-on-year reaching $650,000. Northland also experienced a new high of 4,212 in the REINZ House Price Index, up 33.7% from September 2020. Whilst COVID-19 restrictions slowed down activity in the market, buyer enquiry was strong, and a higher percentage of properties sold by auction — 24.2% in September 2021, up from 7.8% in September 2020.
There was a low level of stock across Northland, down -45.0% from September last year. Further, listings remained low, with a -34.8% decrease year-on-year. Low levels of inventory and listings have meant open homes have seen an uplift in attendees, with vendors asking for slightly higher prices and receiving prompt offers. Northland experienced its lowest September sales count in nine years, with 153 properties sold.
First home buyers are finding it difficult to find properties in their price range, with 38.6% of properties sold for over $750,000 — up from 18.3% at the same time last year. With Auckland remaining at a higher alert level, there has been an increase of out-of-enquiries from Aucklanders looking to move out of the city. Over the next couple of months, as demand continues to outweigh supply, prices are expected to continue to rise with buyer activity picking up as we head into the warmer months.” (REINZ)
The current Days to Sell of 40 days is much less than the 10-year average for September which is 51 days. There were 17 weeks of inventory in September 2021 which is 8 weeks less than the same time last year.
Regional Analysis - Waikato
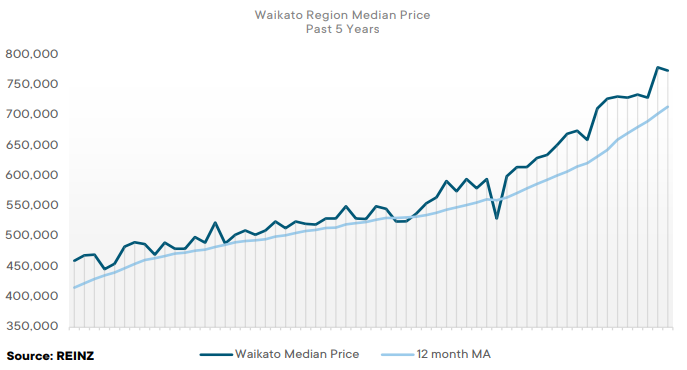
“The Waikato region reached a median house price of $774,500, up 22.0% year-on-year. In addition, four districts in Waikato reached a record median: Hauraki District ($630,000), Otorohanga District ($580,000), South Waikato District ($441,000), and Taupo District ($800,000).
With current COVID-19 restrictions, there is still some hesitation in the market, which has seen listings remain low down -22.5% from September 2020. Like so many other regions across the country, the Waikato is also experiencing a low level of stock, with 883 properties on the market — down from 1,258 in September 2020. Vendors have a higher asking price as many expect a post-lockdown surge like there has been previously. First home buyers are finding it difficult to source properties in their price range due to a low level of stock and 54.4% of properties sold above the $750,000 price point.
As alert levels ease, market activity is expected to increase. And when Auckland reaches a lower alert level, some expect an increase in buyer activity from Aucklanders who want to move permanently, especially for those who have the ability to work remotely.” (REINZ)
The current Days to Sell of 35 days is less than the 10-year average for September which is 38 days. There were 9 weeks of inventory in September 2021 which is 3 weeks less than the same time last year.
Regional Analysis - Bay of Plenty
“The Bay of Plenty saw an increase in median house prices in September, up 24.2% on September 2020, to reach a new record high of $878,000. Two districts in the Bay of Plenty also reached record highs: Tauranga City ($990,000) and Whakatane District ($695,000). Listings are low in the region, with a -16.1% decrease year on year.
Properties are spending longer on the market — median days to sell is 41, up from 36 in September last year. The region also experienced its lowest sales count in a September month since 2014 with 380 properties sold. Some vendors are saying they are waiting on Aucklanders to come view properties, so transactions are being delayed on what would usually be a quick sale. With rising prices in the region, first home buyers who want to use First Home Grants find their options are limited. Of the properties being sold, 27.4% are between the $500,000 to $750,000 price bracket — down from 40.3% a year prior.
With the recent tax changes for investors announced, many expect a decline in investor numbers over the summer period. As alert level restrictions continue to ease in the Bay of Plenty, market activity is expected to increase with more listings coming onto the market.” (REINZ)
The current Days to Sell of 41 days is less than the 10-year average for June which is 44 days. There were 9 weeks of inventory in September 2021 which is 3 weeks less than the same time last year.
Regional Analysis - Gisborne
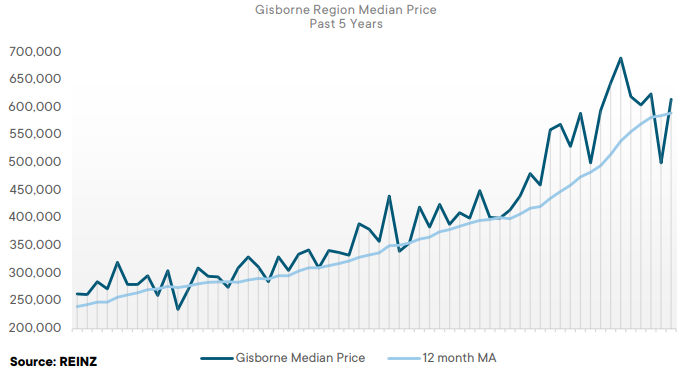
“Gisborne saw median house prices increase 9.8% year-on-year reaching $615,000. Gisborne also reached a new high in the REINZ House Price Index of 4,586, a 36.8% increase year on year. The region has seen a 20.0% increase in inventory year-on-year, yet a slight decrease in listings compared to September last year.
Gisborne experienced its lowest September sales count since 2012, with 38 properties sold. Vendors are starting to list properties by sellers who are bringing their plans forward due to uncertainty around interest rates in the months to come. Properties are spending longer on the market than a year ago, with the median days to sell up ten days from 33 to 43 this month. In the coming months, sellers are expected to reduce their price expectations due to a potential increase in interest rates in conjunction with new criteria around income and debt ratios impacting buyers. The median days to sell is also expected to increase in relation to this.” (REINZ)
The current Days to Sell of 43 days is more than the 10-year average for September which is 35 days. There are 14 weeks of inventory in September 2021 which is 3 weeks less than the same time last year.
Regional Analysis - Hawke's Bay
“The Hawke’s Bay region hit a new record median house price of $770,000 up 31.6% year-on-year. Two districts in Hawke’s Bay also reached record medians: Central Hawke’s Bay District ($615,000) and Hastings District ($812,000).
The Hawke’s Bay market experienced a level of uncertainty in September due to new tax change legislation and COVID-19 restrictions, which saw a decrease in the numbers of investors. Hawke’s Bay had a lower level of stock this month than last September, with 346 properties down from 376. Listings have increased by 15.2% year-on-year, which could largely be due to the easing of alert levels in the region. As we head into the warmer months and as alert levels continue to lower, market activity and listings are expected to continue increasing.” (REINZ)
The current Days to Sell of 38 days is more than the 10-year average for September which is 36 days. There were 10 weeks of inventory in September 2021 which is 2 weeks more than the same time last year.
Regional Analysis - Taranaki
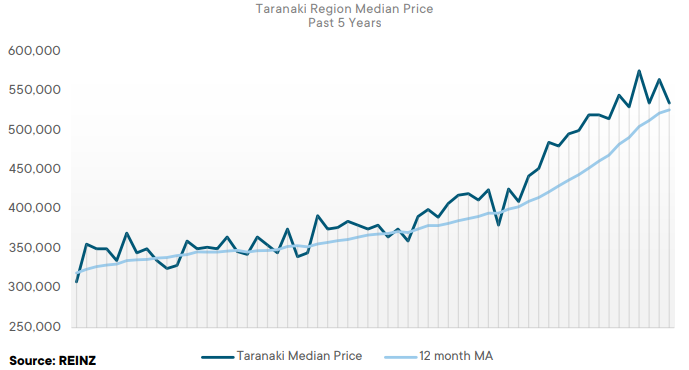
“Median house prices in Taranaki increased 10.3% year-on-year reaching $535,000 up from $485,000 last September. The Stratford District reached a new record high of $530,000, exceeding the record set last month. COVID-19 impacted buyer enquiry, and listings are down -11.4% year-on-year.
Taranaki also has a lower level of inventory than September 2020, down -15.8%. The region also experienced its lowest sales count in a September month since 2007, with 146 properties sold. Prices are on an upward trend, with 36.3% of properties sold between the $500,000 to $750,000 price bracket. This is driven by the short supply of listing stock and an increase in building costs, which are impacting existing house prices. As a result, houses are longer on the market — up 18 days from 24 in September 2020 to 42.
In the coming months, buyer demand is expected to increase as we near Christmas with the low level of stock and as alert levels continue to ease, many are hopeful for an increase in listings.” (REINZ)
The current Days to Sell of 42 days is more than the 10-year average for September which is 36 days. There were 9 weeks of inventory in September 2021 which is 2 weeks less than the same time last year.
Regional Analysis - Manawatu/Whanganui
“The Manawatu/Whanganui region reached a record high median house price of $626,000, up 35.4% year-on-year. Manawatu/Whanganui has had a record price or equal record price in 11 of the past 12 months. Two districts in the region also reached record median house prices: Manawatu District ($720,000) and Tararua District ($500,000). Manawatu/Whanganui had a new House Price Index high of 5,186 and has had the top year-on-year movement in the House Price Index of all the regions for five months in a row. Manawatu/Whanganui has had a -7.4% decrease in the number of listings year-on-year and new listings in the region are attracting good numbers at open homes.
First home buyers are finding their options limited due to low levels of properties in their price range and a low level of stock generally. Investors remain cautious as tax legislation are introduced. Whilst the market remained active in September, it is expected to slow down over the next few months with loan-to-value ratios tightened and an increase in the OCR.” (REINZ)
The current Days to Sell of 39 days is more than the 10-year average for September which is 36 days. There were 10 weeks of inventory in September 2021 which is 3 weeks more than the same time last year.
Regional Analysis - Wellington
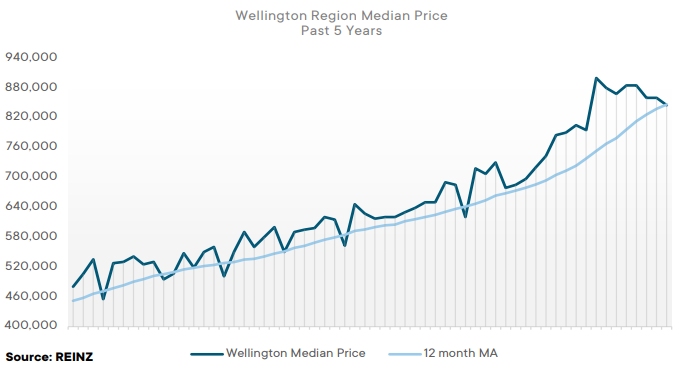
“Median house prices in Wellington increased 13.7%, reaching $845,000. Two districts in Wellington had record median house prices: Porirua City ($1,011,000) and South Wairarapa District ($870,000).
COVID-19 restrictions have impacted Wellington’s market activity with purchasers and listings. However, year-on-year listings have increased by 14.5% when compared to September last year. Furthermore, the median days to sell in Wellington have increased by 15 days from 26 in September 2020 to 41 in September 2021, making it the highest median days to sell in the region since 2008. This could be due to the increase in house prices across the region with 36.0% of properties sold above the $1,000,000 price point compared to 18.8% one year ago. This has resulted in some Wellingtonian investors looking in different regions to buy and sell new builds in areas such as Christchurch, where values are lower. Wellington experienced a new high in the House Price Index of 4,242, up 34.9% year-on-year.
As we head into the warmer months, the usual summer activity is expected – alert levels permitting, with an increase of buyers looking into new builds rather than existing homes.” (REINZ)
The current Days to Sell of 41 days is more than the 10-year average for September of 32 days. There were 7 weeks of inventory in September 2021 which is 1 week more than the same time last year.
Regional Analysis - Nelson/Marlborough
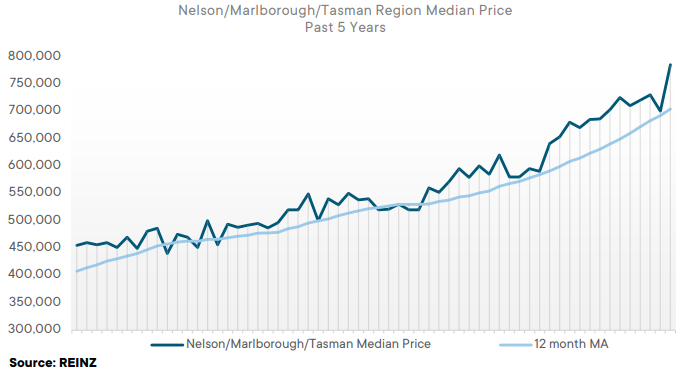
“Median prices increased in the Nelson/Marlborough/ Tasman region, up 24.5%, 22.6% and 27.4% respectively. Nelson experienced a record high of $802,000, with Nelson City also reaching a record median house price of $802,000. Tasman experienced a record median high of $860,000. All three regions experienced a low level of stock — particularly Nelson, which was down -34.9% year-on-year.
Listings continued to stay low in all three regions — particularly Marlborough, which had a -23.8% decline in listings year-on-year. With the recent change to tax deductibility for investors, the market feels a level of uncertainty in conjunction with the restrictions of COVID-19. Sales counts were low; Nelson had its lowest September sales count ever, with 57 properties sold. Many remain hopeful for an uplift in listings as alert levels continue to ease around the country. Buyer interest remains strong, but some vendors are still waiting to list their property. Out of town enquiry is prevalent and, when Auckland’s alert level restrictions ease, this should garner further market activity.” (REINZ)
The current Days to Sell of 39 days is more than the 10-year average for September which is 35 days. There were 11 weeks of inventory in September 2021 which is 1 week more than the same time last year.
Regional Analysis - West Coast
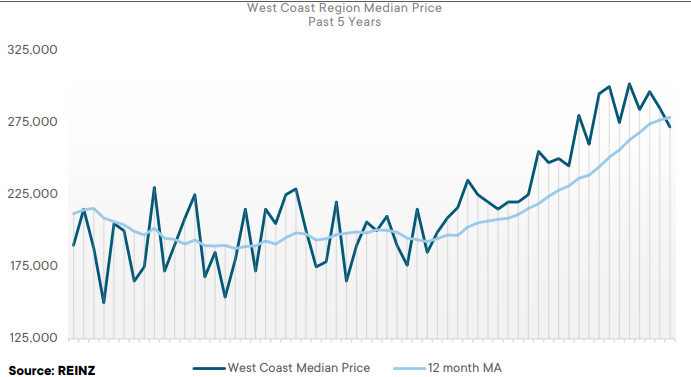
“Median prices for the West Coast have increased 10.0% in September, reaching $272,000. The Westland District also recached a record median high of $445,000. With the COVID-19 lockdown that commenced mid-August, activity has remained subdued in the region, particularly as the seasonal weather arrives and buyers are still hesitant to travel. Listings are low, showing a -26.9% decrease year-on-year.
Stock continues to stay light with a -49.6% decrease from September 2020, the region’s lowest inventory since records began (2007). Due to the low level of stock, the West Coast had its lowest sales count since March 2020, with 26 properties sold. Those properties that are listed are selling fast with the median days to sell at its lowest September median days to sell since 2007. The Westport Ward has seen a decrease in its median price along with its sales count, this is largely attributed to the recent flooding and current uncertainty surrounding flood protection options in the town. Prices in the West Coast remain firm with vendors’ pricing expectations increasing as we head into the summer market.” (REINZ)
The current Days to Sell of 36 days is much less than the 10-year average for September which is 88 days. There were 22 weeks of inventory in September 2021 which is 32 weeks less than the same time last year.
Regional Analysis - Canterbury
“The Canterbury region reached a record high in September of $660,000, up 31.0% year-on-year. Four districts in Canterbury also reached record medians: Christchurch City ($670,000), Hurunui District ($651,000), Selwyn District ($775,000), and Waimate District ($395,000). Selwyn District has the longest record median streak of all the Territorial Authorities, with five in a row. The Canterbury region has also reached a new high on the House Price Index of 3,644 – a 36.2% increase year-on-year.
Like so many other regions around the country at this time, the Canterbury region has experienced uncertainty around COVID-19 Alert Levels and confusion around what real estate activity can be undertaken. The region has seen a decline in viewings and attendees at open homes. Buyers have a fear of not finding anything which is seeing some people hesitant to list their property on the market in case they are unable to secure another property. Whilst listings have decreased -8.5%, buyer enquiry is still strong, particularly from people out of town. Lockdown has proven that Christchurch is a desirable place to live with the value and lifestyle opportunities it presents.
Stock remains low in Canterbury, down -36.6% when compared to September 2020. First home buyers are active in the market, especially in the new build category. Auctions were a popular sales method this month, with 36.9% of properties sold by auction compared to 16.8% in September last year. When the Canterbury region reaches Alert Level 1, there will be more certainty in the market and people will start to list their properties which should see a strong finish to the end of the year.” (REINZ)
The current Days to Sell of 33 days is more than the 10-year average for September which is 32 days. There were 9 weeks of inventory in September 2021 which is 3 weeks less than the same time last year.
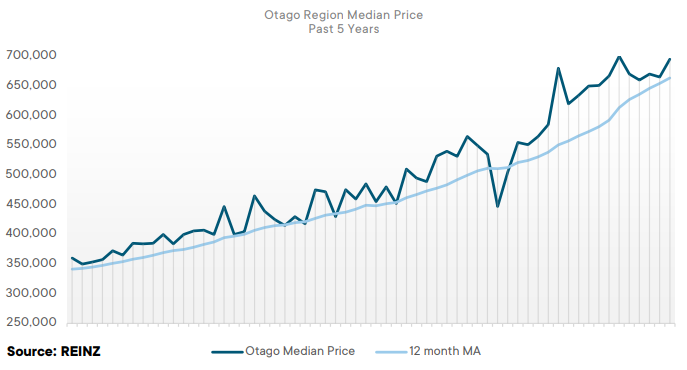
Regional Analysis - Otago
Dunedin City - “Median house prices reached $642,500, up 13.4% year-on-year. COVID-19 has seen properties spending longer on the market, with the median days to sell up 15 days to 37 from 22 in September last year. Sales volumes were higher than expected considering the first week of September was spent in Alert Level 3 Lockdown. Listing numbers for Dunedin city remain steady. First home buyers are finding it difficult to get their foot on the property ladder with prices rising across the region. Meanwhile, investors are starting to become more active but mainly in the new build category. Sales volumes, listings and inventory are expected to increase as we near Christmas and COVID-19 Alert Levels ease across the country.” (REINZ)
Queenstown Lakes -“The Queenstown Lakes District saw median house prices increase 23.7% year-on-year reaching $1,310,000. The Queenstown-Wakatipu Ward reached a record median of $1,285,000, up 17.9% year-on-year — along with Wanaka, which also reached a record median reaching $1,300,000 up 39.8% year-on-year. Properties are selling faster, the median days to sell decreased by 22 — from 59 days in September 2020 to 37 days this month. The number of first home buyers has decreased as finance is taking longer to secure, along with the rise of house prices making homes unaffordable for some.
COVID-19 restrictions have affected Aucklanders’ ability to view property in the region. However, there is still good interest in the market, which is expected to pick up as alert levels continue to ease, particularly in Auckland.” (REINZ)
The current Days to Sell of 36 days is more than the 10-year average for September which is 33 days. There were 9 weeks of inventory in September 2021 which is 8 weeks less than the same time last year.
Regional Analysis - Southland
“The Southland region saw median house prices increase 29.1%, reaching a record high of $437,580 in September. Invercargill City also reached a record median of $455,000. Market activity in the region is lesser than it normally would be in September due to COVID-19 Alert Level restrictions. There has been a -18.5% decrease in listings year-on-year and a low level of inventory, with stock being down -24.5% year-on-year. The properties that are listed are selling relatively fast. The median days to sell is 31 days. Southland was the only region where the median days to sell in September was less than the median days to sell last month (33 days).
The region has seen a decline in the numbers of investors in the market, this may largely be due to COVID-19 and the change to tax legislation announced in September. This, along with loan to value ratios and COVID-19 is potentially affecting buyer activity in the region. As alert levels continue to ease, market activity is expected to increase as we head into the summer market.” (REINZ)
The current Days to Sell of 31 days is less than the 10-year average for September which is 33 days. There were 12 weeks of inventory in September 2021 which is 1 week more than the same time last year.