Property market rebounds in October following a September Dip - REINZ Stats October 2021
Friday, 12 November 2021

Despite the restraints the market is operating under, this is a stronger than average October month. We’re seeing the continuation of what is a firm market, despite the pandemic (REINZ).
Jen Baird, Chief Executive at REINZ says: "October shows a marked increase in sales activity on September and August, boosted by the usual spring uplift. While across New Zealand, sales activity decreased year-on-year by 21.7%, there was a 30.3% increase month-on-month. Despite the restraints the market is operating under, this isa stronger than average October month. We’re seeing the continuation of what is a firm market, despite the pandemic.
Lockdown restrictions are having a reduced impact. Real estate professionals have the resources to conduct business remotely, and customers/clients have the confidence to move forward to make decisions. Steps by the Government — as advocated for by REINZ on behalf of members — to enable more private property viewings at Alert Level 3, for example, have helped – especially in areas longest affected by tighter lockdown. Less stringentrestrictions equate to more activity.
Comparing listing and sales activity over this lockdown to the country’s first one in 2020, shows a sharp difference. Namely, the impact has not been so severe, and the recovery has been quicker.
October is the beneficiary of increased listings in the month prior. It is expected that sales activity across New Zealand will continue to rise in the coming months, as restrictions ease further, travel limitations lift and those who previously held back listing their property do so. The demand is certainly there,” Baird observes.
The seven regions that reached record median prices in October were:
- Waikato: 23.6% increase from $651,000 in October 2020 to a new record of $805,000 in October 2021.
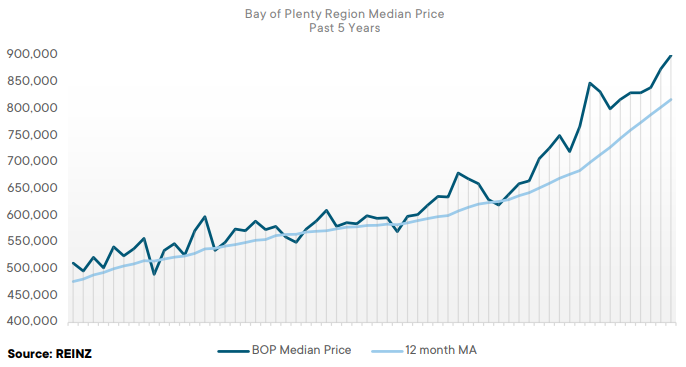
- BOP: 23.9% increase from $726,500 in October 2020 to a new record of $900,000 in October 2021.
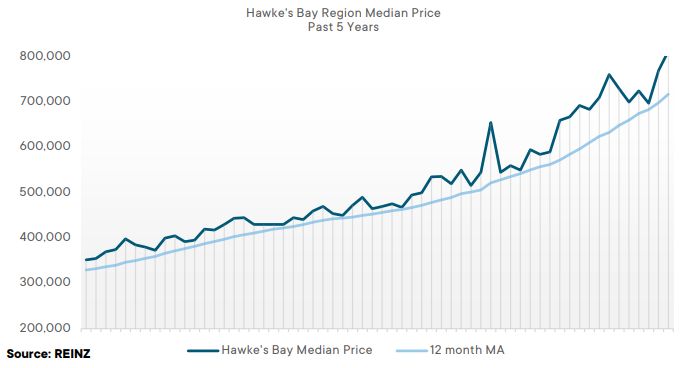
- Hawke's Bay: 37.7% increase from $590,000 in October 2020 to a new record of $812,500 in October 2021.
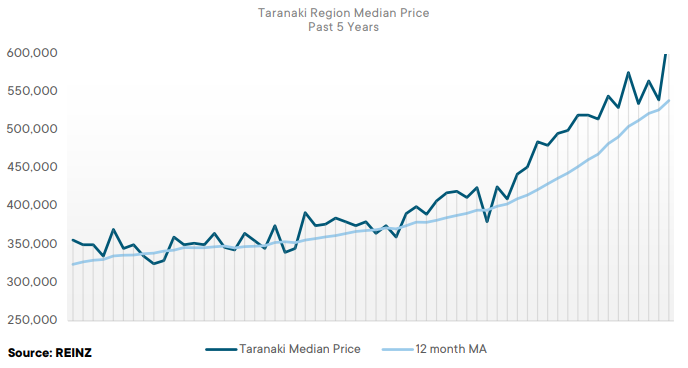
- Taranaki: 31.1% increase from $480,500 in October 2020 to a new record of $630,000 in October 2021.
- Wellington: 26.8% increase from $785,000 in October 2020 to a new record of $995,000 in October 2021.
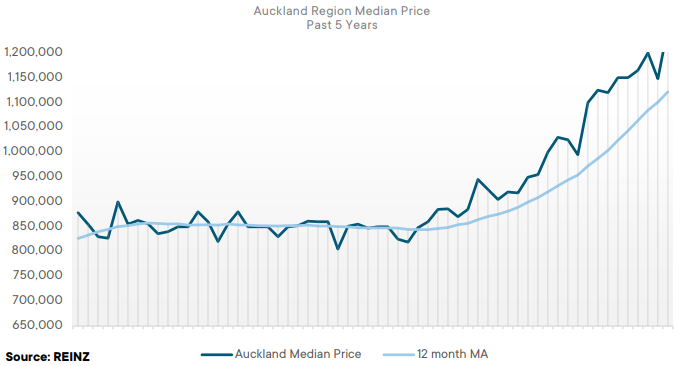
Regional Analysis - Auckland
“Median house prices in Auckland reached a new record high of $1,250,000 – a 25.0% increase from October 2020. Six Auckland districts reached record high median prices in October: Auckland City ($1,393,000), Franklin District ($1,000,000), Manukau City ($1,165,000), North Shore City ($1,475,000), Papakura District ($1,101,000), and Waitakere City ($1,128,000). Auckland hit a new high in the REINZ House Price Index of 4,149, up 25.7% year-on-year. The sales count in the region has seen an 85.5% increase from that of last month, yet still down 20.3% when compared to October last year. “Auckland still has a low level of stock, 16.8% less year-on-year.
Compared to September 2021, listings have increased this month as people preparing their property for sale in Alert Level 4 have decided to list their property. The properties that are listed spent longer on the market due to the time it takes showing a volume of buyers through homes with the Level 3 Covid-19 protections in place.
In October, the median days to sell increased by 15 days when compared to October last year – from 30 to 45. This is Auckland’s highest median days to sell since June 2020, and the highest for an October month in 20 years. With Auckland still in Alert Level 3, virtual auctions have remained a popular method of sale throughout the lockdown and October saw 44.8% of properties sold by auction, up from 39.8% a year prior. Numbers of investors are lighter this October with some suggestion that tax, LVR and OCR changes are starting to take effect. Buyer demand is strong and as alert levels ease and borders open, this will increase further.” (REINZ)
The current Days to Sell of 45 days is much more than the 10-year average for October which is 34 days. There were 20 weeks of inventory in October 2021 which is 8 weeks more than the same time last year.
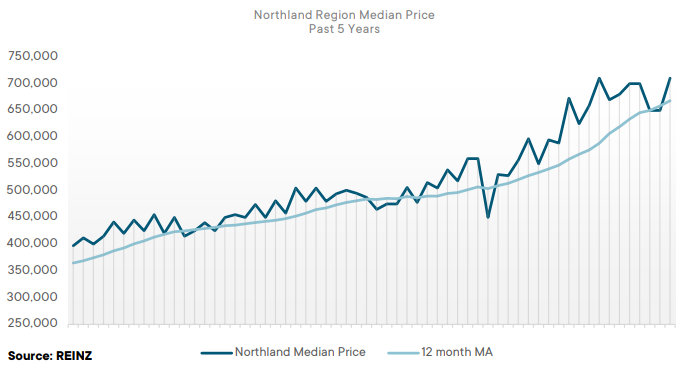
Regional Analysis - Northland
“Median house prices in the Northland reached a record equaling $710,000 in October – a 19.3% increase year-on-year. The Whangarei District reached a record high of $800,000. Buyer demand is strong in the region, and with the level of stock in Northland still low (537, down from 857 this time last year), properties that are listed are selling quickly. The median days to sell was down by 2 days from 39 to 37 compared to October last year.
Northland had its equal lowest median days to sell since records began in an October month — equal to October 2005, 2006, and 2007). “Open homes are busy with locals and, as alert levels ease in Auckland, numbers are expected to increase further. The low level of stock allows for competitive pricing – 77.0% of properties are now being sold over the $500,000 price point compared to 66.6% in October 2020. Northland is starting to see more property listings coming on to the market, and its sales count has increased by 10.8% from September – still a 40.0% decrease from October 2020. Northland had its lowest October sale count since 2012, with 174 properties sold. The usual influx of spring listings has been delayed, so may come through in the months leading up to Christmas.” (REINZ)
The current Days to Sell of 37 days is much less than the 10-year average for October which is 49 days. There were 16 weeks of inventory in October 2021 which is 10 weeks less than the same time last year.
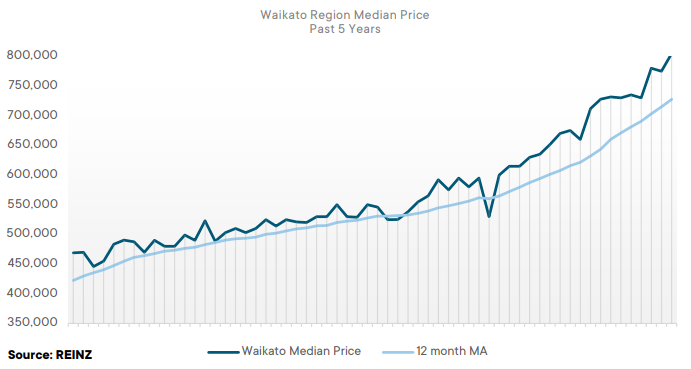
Regional Analysis - Waikato
“The Waikato region saw its median house price reach a new record high of $805,000 – a 23.6% increase from October last year. Five districts in the Waikato also reached record median highs: Hauraki District ($645,000), South Waikato District ($495,000), Thames-Coromandel District ($1,010,000), Waikato District ($825,000), and Waipa District ($880,000). The Waikato region saw a new high on the REINZ House Price Index of 4,629 – a 34.1% increase from October 2020. Waikato also experienced its highest sales count (678) since March 2021. However, it saw a 30.4% decrease in its sales count year-on-year. “Newly available listings are starting to increase. However, the volume is less than the usual spring count – a 30.4% decrease from last year.
Some people may be waiting to list their property until the Waikato region opens up and Aucklanders are able to come view and purchase, which could be adding to Waikato’s low level of inventory. It is becoming harder for first home buyers to find properties within their price range, with 33.0% of properties sold between the $500,000 to $749,999 price band, compared to 46.0% this time last year. A number of buyers are also finding it challenging to get access to finance. As alert levels ease in the region and Auckland, and as borders open, market activity is expected to see an uplift and prices should ease.”(REINZ)
The current Days to Sell of 30 days is less than the 10-year average for October which is 35 days. There were 9 weeks of inventory in October 2021 which is 1 week less than the same time last year.
Regional Analysis - Bay of Plenty
“Median house prices in the Bay of Plenty region increased by 23.9% year-on-year, reaching a new record high of $900,000. Three districts in the Bay of Plenty also reached record highs: Rotorua District ($695,000), Tauranga City ($1,050,000), and Whakatane District ($755,000). The usual uplift of market activity in spring has been delayed in the region due to COVID-19 restrictions. However, the Bay of Plenty has started to see more listings come onto the market this October. The region is still experiencing a low level of stock which is down 13.2% compared to October 2020. “People are acting with a level of caution around the uncertainty of COVID-19 and the potential rise of interest rates. The Bay of Plenty is seeing a decrease in its numbers of investors, which could be due to many of them residing in Auckland and Waikato – both experiencing heightened COVID-19 restrictions.
Properties are selling faster than last month; the average days to sell is now 35, down from 41 in September but up from 34 in October last year. As alert levels ease around the country and the feeling of uncertainty dwindles, this should see more properties come onto the market and an increase of activity from outside the region.” (REINZ)
The current Days to Sell of 35 days is less than the 10-year average for October which is 41 days. There were 9 weeks of inventory in October 2021 which is 2 weeks more than the same time last year.
Regional Analysis - Gisborne
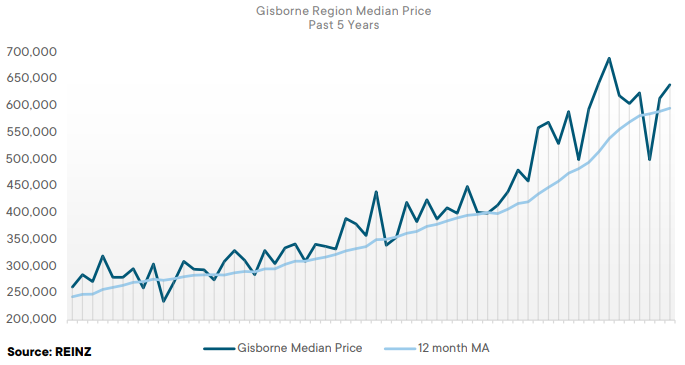
“Gisborne region’s median house price increased by 12.3% from October 2020, reaching $640,000. Gisborne/Hawke’s Bay also reached a new high on the REINZ House Price Index of 4,571 – a 32.0% increase year-on-year. Gisborne’s inventory levels have also increased by 3.5% year-on-year due to the usual uplift that spring brings, alert level restrictions easing and people wanting to maintain a sense of normality. When compared to this time last year, the median days to sell has increased by five days from 31 to 36. This could be due to clearance rates at auctions dropping and properties selling conditionally afterwards. First home buyers are less prevalent in the market when compared to this time last year and finance is becoming more challenging to access.
Vendors are setting slightly higher asking prices this October. When more properties come onto the market in the following months, purchasers will have more properties to choose from, which may start to create a gap between what vendors want and what the market is willing to pay.” (REINZ)
The current Days to Sell of 36 days is less than the 10-year average for October which is 36 days. There are 10 weeks of inventory in October 2021 which is 12 weeks less than the same time last year.
Regional Analysis - Hawke's Bay
“The Hawke’s Bay region saw an increase in its median house price of 37.7%, reaching a new record high of $812,500. Three districts in the Hawke’s Bay region also saw record median house prices: Central Hawke’s Bay District ($650,000), Hastings District ($885,000), and Napier City ($812,000). Like many other regions around the country, Hawke’s Bay has started to receive an influx of out of town enquiry, which is expected to increase when restrictions elsewhere ease.
The Hawke’s Bay region has also seen an increase in its inventory levels of 2.0%, from 398 to 406 year-on-year. Listings have also increased by 6.5% year-on-year. The increase in market activity and properties on the market should further rise as we near Christmas.”(REINZ)
The current Days to Sell of 30 days is less than the 10-year average for October which is 34 days. There were 9 weeks of inventory in October 2021 which is 1 week more than the same time last year.
Regional Analysis - Taranaki
“Taranaki saw a median house price of $630,000, up 31.1% from October 2020 — a new record high. The New Plymouth District also saw a record median of $700,000, exceeding its previous record set in August. Taranaki is still experiencing a low level of stock, which is down 18.2% compared to October 2020.
Demand continues to outweigh supply, which has had an impact on the prices vendors ask for. New listings have started to make their way onto the market, and these properties are selling quickly. The median days to sell has decreased by 14 days when compared to last month. However, it has increased by six days — from 21 to 27 — year-on-year. Some first home buyers are feeling disheartened by the rising prices in the region, with 26.1% of properties now being sold for between the $250,000 to $499,999 price bracket, compared to 49.8% a year prior.”(REINZ)
The current Days to Sell of 27 days is less than the 10-year average for October which is 33 days. There were 7 weeks of inventory in October 2021 which is 3 weeks less than the same time last year.
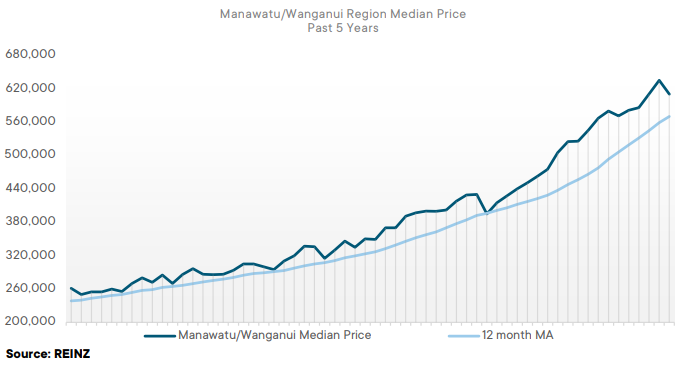
Regional Analysis - Manawatu/Whanganui
“The Manawatu/Whanganui region saw its median house price rise to $610,000 – a 28.4% increase year-on-year. The Manawatu/Whanganui region reached a new high on the REINZ House Price Index scale of 5,306 – a 42.6% increase of October 2020. Manawatu/Whanganui has had the top year-on-year movement in the House Price Index for six months in a row. Housing market activity in Manawatu/Whanganui is starting to recover from the August COVID-19 lockdown.
However, some investors and buyers are acting with a level of caution around the future impact of the loan-to-value ratio rules, and banks are tightening lending to buyers. The region saw levels of inventory increase by 31.6% in October, and listings increased on September 2021 figures, which could be due to the time of the year and easing of alert levels. There were fewer first home buyers in the market in October due to prices becoming out of reach as well as a slight reduction at attendees at open homes.” (REINZ)
The current Days to Sell of 29 days is less than the 10-year average for October which is 34 days. There were 10 weeks of inventory in October 2021 which is 4 weeks more than the same time last year.
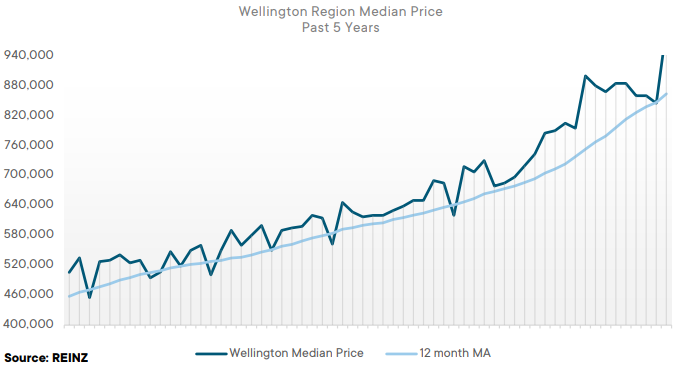
Regional Analysis - Wellington
“The Wellington region reached a new record high median house price of $995,000 – a 26.8% increase year-on-year. Five districts in Wellington also reached record median highs: Kapiti Coast District ($980,000), Lower Hutt City ($890,000), Masterton District ($720,000), Porirua City ($1,115,000), and Wellington City ($1,157,000). This October, the Wellington region had a low sales count (700) – its lowest October month sales since 2014. Wellington experienced a lack of activity from outside the region, perhaps due to a fear of entering another lockdown, leaving some people hesitant to buy or sell. In October, Wellington’s levels of inventory saw an increase of 35.3% year-on-year and new listings increased by 13.9% – one of just two regions to have an increase in listings this October.
Interest rates have been a popular topic among buyers, and it is noted that investors had a focus on purchasing new builds in October. As alert levels ease around the country and we head further into the warmer months Wellington’s market activity is expected to increase.” (REINZ)
The current Days to Sell of 33 days is more than the 10-year average for October of 30 days. There were 7 weeks of inventory in October 2021 which is 1 week more than the same time last year.
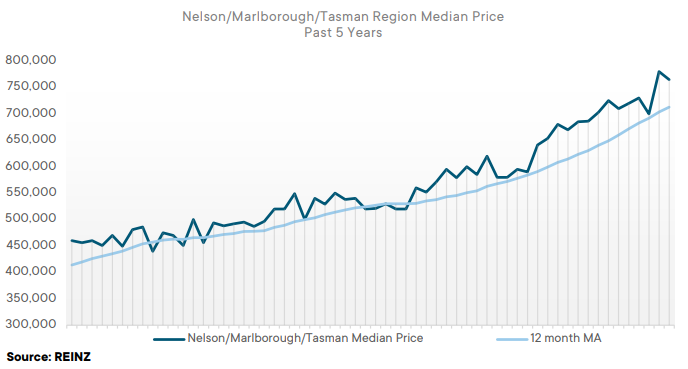
Regional Analysis - Nelson/Marlborough
“Median prices in the Nelson/Marlborough/Tasman region increased in October 2021 when compared to the same time last year up 17.0%, 14.5% and 28.6%, respectively. Nelson reached $750,000, Marlborough reached $647,000, and Tasman reached a new record high of $900,000. Furthermore, the Tasman region had its highest sales count since November 2020, with 74 properties sold.
Marlborough saw a lift in stock levels this October, with an 11.3% increase year-on-year, and Nelson saw a decrease of 39.4% year-on-year. Both regions saw a decrease in new listings of 4.5% (Marlborough) and 31.1 (Nelson) year-on-year. Nelson had its lowest October month sales count since 2010 (67), and Marlborough had its lowest October month sales since 2011 (66).
“Due to the low level of stock and easing of alert levels, all three regions had good attendance at open homes, and the competitive nature of the market has seen short sales timelines and multi-offer situations. When compared to this time last year, all three regions noted a decrease in first home buyers and investors, which could be due to caution around tax legislation changes and the possibility of rising interest rates. With buyer demand strong and a low level of stock, market activity is expected to remain consistent in the coming months. Some expect the usual busyness of spring to arrive later in the year along with easing alert levels which will present the opportunity to travel and for the market to welcome back out of towners.” (REINZ)
The current Days to Sell of 27 days is less than the 10-year average for October which is 35 days. There were 9 weeks of inventory in October 2021 which is the same as the same time last year.
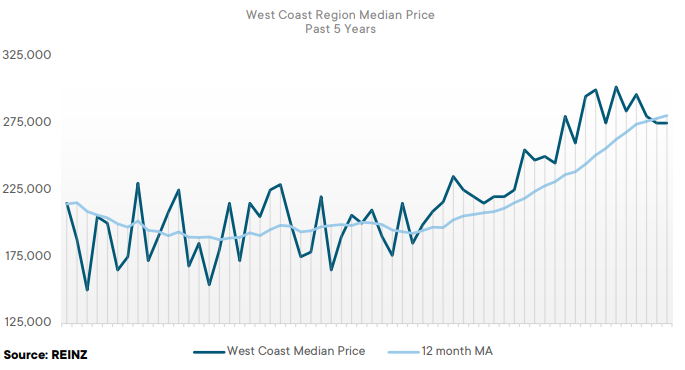
Regional Analysis - West Coast
“The West Coast region saw a 10.0% increase in its median house price year-on-year, reaching $275,000. Like so many other regions in New Zealand, the West Coast has reached the point where supply cannot keep up with demand. This October saw a 55.2% decrease in its sales count and a 42.6% decrease in its levels of inventory. Compared to September, listings lifted slightly. However, they were still down 29.3% compared to October last year, which is resulting in a drop off in sales numbers. The West Coast region had its lowest October month sales count in six years with 26 properties sold compared to 58 in October 2020.
Properties that are listed are selling fast – in October, the West Coast had its lowest median days to sell since 2006 (34 days). Investor interest has been evident with multi-offers now the expectation on the back of good returns and low vacancy rates. Some predict a slowdown in the next few months if stock continues to decline, but the hope remains that as alert levels continue to ease, it will generate more activity and listings creating choice for buyers. (REINZ)
The current Days to Sell of 34 days is much less than the 10-year average for October which is 98 days. There were 31 weeks of inventory in October 2021 which is 1 week more than the same time last year.
Regional Analysis - Canterbury
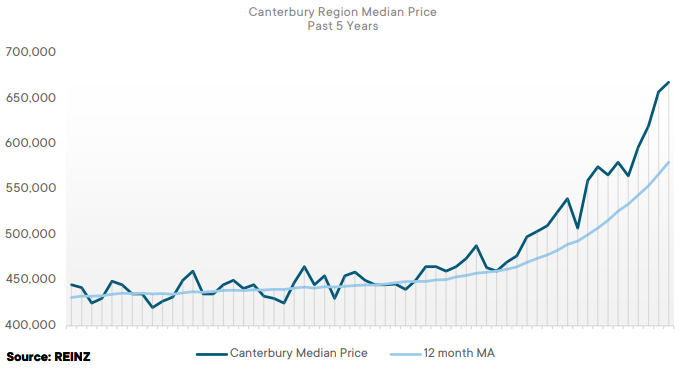
“The Canterbury region reached a new record median house price this October of $668,000 – a 31.0% increase year-on-year. Four districts in Canterbury also reached record highs in their median house prices: Ashburton District ($500,000), Christchurch City ($685,000), Selwyn District ($815,000), and Waimakariri District ($685,000). Canterbury has shown record prices in the past four consecutive months, and the Selwyn District has the longest median streak of all the territorial authorities, with six in a row.
This October, the Canterbury region saw a significant growth in auctions with 41.2% of sales by auction, up from 19.9% in October 2020. Online auction rooms had good attendance, and auctions have been more popular with vendors wanting to see the open market in action. Open homes attracted good numbers and out of town enquiry is strong – particularly from Aucklanders looking to move away from the city. “The numbers of first home buyers dropped slightly, but the determination to get onto the property ladder in this pool of buyers remains high. Compared to this time last year, investor numbers have increased, with some looking to increase their portfolios. The Canterbury market is still competitive with a good pool of tenants.
Compared to this time last year, investor numbers have increased, with some looking to increase their portfolios. The Canterbury market is still competitive with a good pool of tenants. Levels of inventory are still low, with a 30.6% decrease year-on-year, and whilst listings had an increase month-on-month, they are still down on what they would normally be for an October month. When Auckland’s borders open, it is expected that some Aucklanders will move to Canterbury or its surrounding areas.” (REINZ)
The current Days to Sell of 28 days is less than the 10-year average for October which is 30 days. There were 9 weeks of inventory in October 2021 which is 1 week less than the same time last year.
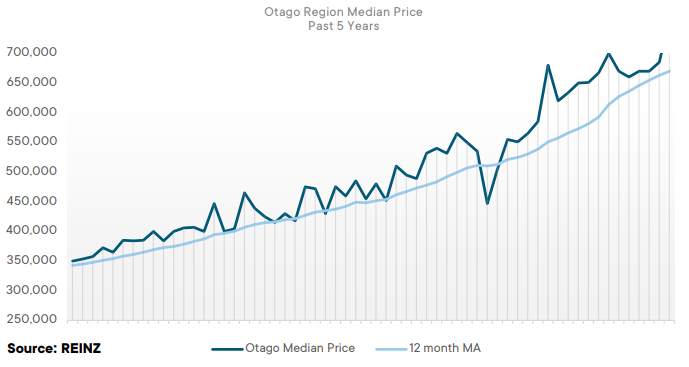
Regional Analysis - Otago
Dunedin City - “Dunedin City saw its median house price increase 20.5% year-onyear reaching $675,000. All four Wards in Dunedin City also saw year-on-year increases in median house prices. First home buyers are having difficulty finding affordable properties, and delays in access to finance are adding further challenges. Fewer investors are looking for established investment homes due to the first step of interest deducibility rules kicking in from 1 October 2021, along with the bright-line property rule. The sales count in October this year saw a 25.4% decrease when compared to October 2020, and properties are spending longer on the market with the median days to sell increasing by five days year-on-year — from 23 to 28. This may be in part due to more choice with listing numbers since coming out of lockdown. Certain properties are attracting strong interest from Auckland as people assess their post lockdown options.” (REINZ)
Queenstown Lakes - “The Queenstown Lakes District saw median house prices increase 40.4% year-on-year, reaching $1,355,000. All three wards in the Queenstown Lakes District saw a year-on-year increase. The Arrowtown Ward had a 22.9% increase when compared to October last year, reaching $1,530,000. The Queenstown-Wakatipu Ward had a median house price increase of 30.1%, reaching $1,275,000. The Wanaka Ward, which saw a 35.5% increase year-on-year, reached $1,490,000.
“The housing market remained active in October, and properties sold fast, with the median number of days to sell down by 26 days from 63 in October 2020 to 37 in October 2021. The sales count decreased by 42.3% this year, which appears to be largely due to the low level of stock as property owners in the region are showing reluctance to move from the area. There is a strong interest from buyers outside the area to purchase, often buying sight unseen, meaning new listings are in short supply but selling quickly. This is expected to continue in the coming months, particularly as Auckland’s alert levels ease which should see a further uplift in out of town market activity.” (REINZ)
The current Days to Sell of 30 days is less than the 10-year average for October which is 32 days. There were 9 weeks of inventory in October 2021 which is 2 weeks less than the same time last year.
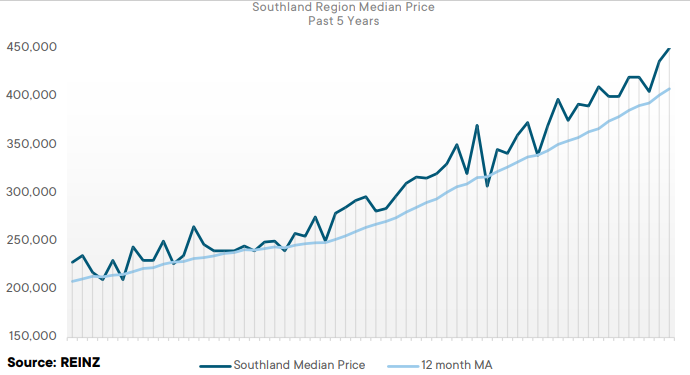
Regional Analysis - Southland
“Median house prices in the Southland region increased 21.6% annually from 370,000 in October 2020 to 450,000 in October 2021. The Southland district also reached a new record high of $510,000. Southland’s inventory levels are verging on steady with only a 1.0% decrease in stock levels year-on-year. This is much the same for its number of new listings. Whilst Southland had a 6.8% increase in its listings from September 2021, they were down 3.1% year-on-year.
“Some note that the October market in Southland is beginning to move at pace but not as busy as what it would normally be for an October month. This is largely due to the COVID-19 restrictions delaying the usual spring flurry. The lower level of stock is allowing prices to keep rising. This October, first home buyers were more prevalent in the market but still not as many as there were this time last year. Over the next few months, the housing market should remain steady and start to increase in activity once alert levels ease all around the country.” (REINZ)
The current Days to Sell of 27 days is less than the 10-year average for October which is 30 days. There were 9 weeks of inventory in October 2021 which is 2 weeks less than the same time last year.