Prices continue to rise, growth rate shows signs on easing - REINZ Stats November 2021
Tuesday, 14 December 2021

Property prices climbed further in November, early signals suggest price growth will continue though more moderately, according to the latest data from the Real Estate Institute of New Zealand (REINZ), source of the most complete and accurate real estate data in New Zealand.
Median prices for residential property across New Zealand increased by 23.8% from $747,000 in November 2020 to $925,000 in November 2021 — a new record high. While the median house price for New Zealand excluding Auckland increased annually by 26.0% from $615,000 to a new record of $775,000. There was a monthly increase in median prices of 3.7% across New Zealand and 3.2% for New Zealand excluding Auckland.
Jen Baird, Chief Executive of REINZ, says: “The market has settled back into its stride — returning to business as near-usual across the board. November shows an active market where property prices continue to increase, stimulated by demand as New Zealand prepared to leave Alert Levels behind.
“Across New Zealand, there was an annual increase of 23.8% in median prices — with a new record high of $925,000 in November 2021 and an increase of 3.7% month-on-month. We’re seeing a firm property market, with all regions experiencing annual growth and 24 territorial authorities reaching new record medians.
“FOMO — fear of missing out — is beginning to dissipate. The enduring strength of property prices means some vendors may be less inclined to act now, without fear of missing their preferred prices later. While the supply versus demand imbalance continues to push prices upwards, across New Zealand inventory levels increased 5.1% annually and listings increased 9.0% — providing buyers more choice and giving reluctant sellers confidence that if they take their current property to market, they will be able to buy their next one.
“Despite steady growth, headwinds are gathering. Government measures to moderate the New Zealand property market, the Reserve Bank’s OCR increases and growing challenges around financing as banks tighten their lending criteria are aligning. While the longer-term impacts of these changes will play out over the coming months, the strength of the market suggests that the growth trend will continue — albeit with a more moderate trajectory,” Baird adds.
In addition to Auckland, the following regions reached record median prices in November:
- Northland: 26.5% increase from $651,000 in November 2020 to a new record of $805,000 in November 2021.
- Waikato: 27.6% increase from $726,500 in November 2020 to a new record of $900,000 in November 2021.
- Hawke's Bay: 25.8% increase from $590,000 in November 2020 to a new record of $812,500 in November 2021.
- West Coast: 42.9% increase from $480,500 in November 2020 to a new record of $630,000 in November 2021.
- Canterbury: 31.4% increase from $785,000 in November 2020 to a new record of $995,000 in November 2021.
Regional Analysis - Auckland
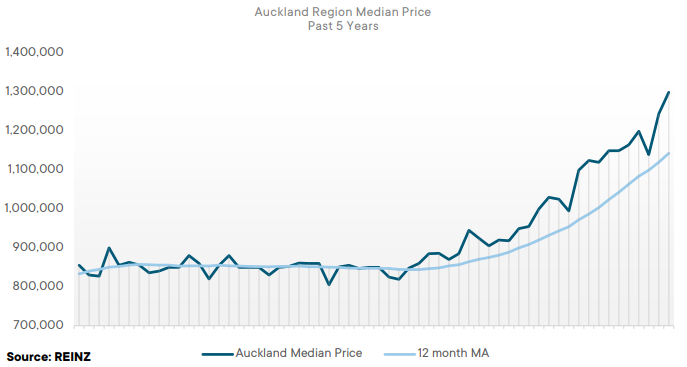
“The Auckland region has shown continued strength in November with prices increasing 26.2% year-on-year to a record median of $1,300,000. Six of the seven districts in Auckland reached record median prices: Auckland City ($1,540,000), Manukau City ($1,235,000), North Shore City ($1,555,000), Papakura District ($1,173,000), Rodney District ($1,310,000), and Waitakere City ($1,199,000). Auckland has seen an increase in inventory levels of 4.5% year-on-year, along with an uplift in listings by 10.4% year-on-year. Properties are spending a shorter time on the market, with the median days to sell at 30 days — Auckland’s lowest days to sell since December 2020.
“Buyer numbers are starting to increase as the market is invigorated with more choice. Many buyers remain confident that prices will hold, and demand will remain strong over the summer period with some noting the possible increase in kiwis arriving home MIQ-free in early 2022. Investor numbers have declined — the legislative changes as well as the need for upgrades to meet Healthy Homes Standards is adding to the increasing costs for investors. When Auckland’s borders open, it will be interesting to see if those who have been reassessing their lifestyle and how they want to use their finances move to other areas of the country.” (REINZ)
The current Days to Sell of 30 days is less than the 10-year average for November which is 33 days. There were 14 weeks of inventory in November 2021 which is 3 weeks more than the same time last year.
Regional Analysis - Northland
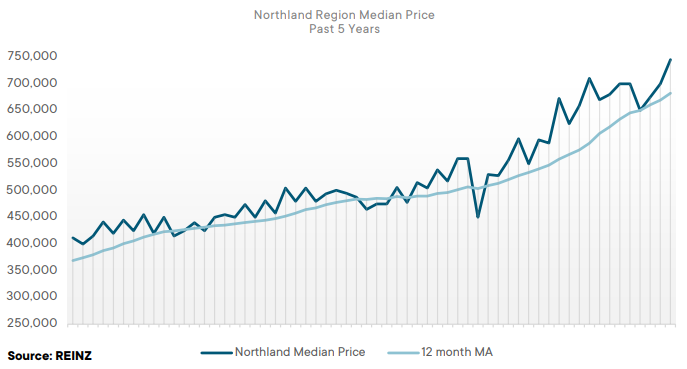
“The Northland region saw a record median house price of $745,000 in November 2021, up 26.5% from the same time last year. Two districts in Northland also reached record medians: Far North District ($817,500) and Kaipara District ($905,000). Despite stock levels decreasing 18.9%, Northland was one of four regions in New Zealand that had over 10 weeks of inventory (18 weeks inventory). Properties are selling quickly in Northland, with the region experiencing its lowest November median days to sell since 2005 (35 days).
“Direct buyer enquiry is beginning to slow, but interest remains high, and this is expected to accelerate once Auckland’s borders open. Auctions have proven a popular method of sale in the region, with 21.7% of sales by auction up from 13.1% in November 2020. Anecdotally, more negotiation has been required on the auction floor with vendors adjusting reserves. Whilst there have been some noteworthy sales, some are noticing a decline in buyers, with preapprovals becoming more difficult as banks exercise caution. Northland had its lowest November sales count since 2014 with 203 properties sold.” (REINZ)The current Days to Sell of 35 days is much less than the 10-year average for November which is 45 days. There were 18 weeks of inventory in November 2021 which is 6 weeks less than the same time last year.
The current Days to Sell of 35 days is much less than the 10-year average for November which is 45 days. There were 18 weeks of inventory in November 2021 which is 6 weeks less than the same time last year.
Regional Analysis - Waikato
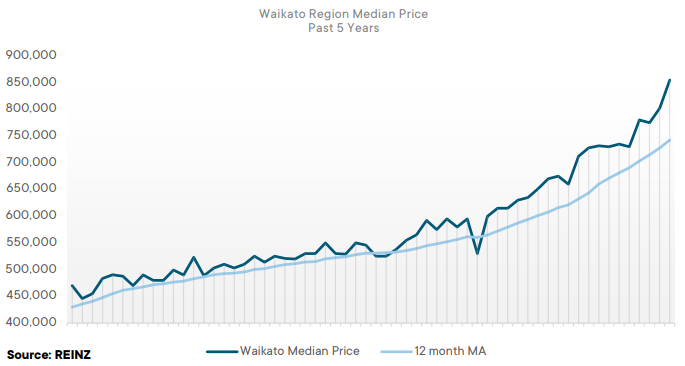
“Median house prices in the Waikato region increased 27.6% year-on-year in November to a record high of = $855,000. Three districts in Waikato also reached record highs: Hamilton City ($881,000), Thames-Coromandel District ($1,130,000), and Waikato District ($950,000). Inventory levels have started to recover from previous months with an increase of 9.8% from the same time last year — listings also saw an uplift of 9.5% year-on-year. Finance is still an issue for buyers — the amendments to the loan-to-value ratios and rising interest rates are making it harder for people to purchase.
“Recent cases of COVID-19 in the region have impacted the number of attendees at open homes. However, those who need to buy property are doing so without hesitation. Most buyers are local, but as Auckland’s borders open, some predict a lift in market activity as Aucklanders can travel again. Auctions were a popular method of sale in November with 29.4% of sales by auction — up from 18.5% this time last year.” (REINZ)
The current Days to Sell of 28 days is less than the 10-year average for November which is 35 days. There were 10 weeks of inventory in November 2021 which is 2 weeks more than the same time last year.
Regional Analysis - Bay of Plenty
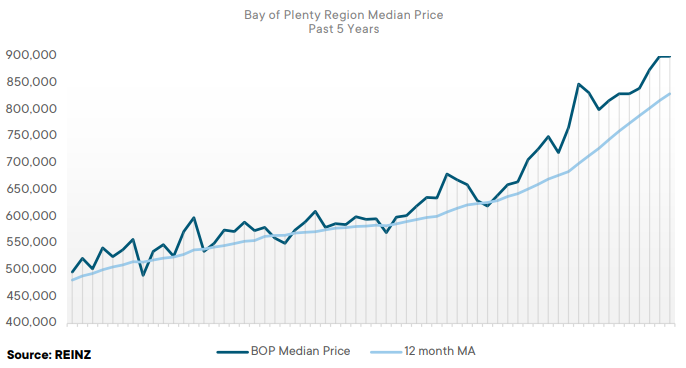
“The Bay of Plenty saw an equal record median house price of $900,000 in November 2021, up 20.0% from November 2020. The Bay of Plenty experienced an increase in inventory levels of 10.6% year-on-year and a slight increase in new listings of 1.4% compared to November last year. The market is beginning to slow ahead of the standard Christmas easing. The usual spike in activity, which generally occurs mid-November, was subdued.
“Having more properties on the market has seen median days to sell increase by three days from 30 in November 2020 to 33 in November this year. Investors were not as active in the market in November, and this was particularly noticeable when Auckland and Waikato were in Alert Level 3 restrictions. First home buyers were also less prevalent with many turned down for preapproval.” (REINZ)
The current Days to Sell of 33 days is less than the 10-year average for November which is 41 days. There were 9 weeks of inventory in November 2021 which is 2 weeks more than the same time last year.
Regional Analysis - Gisborne
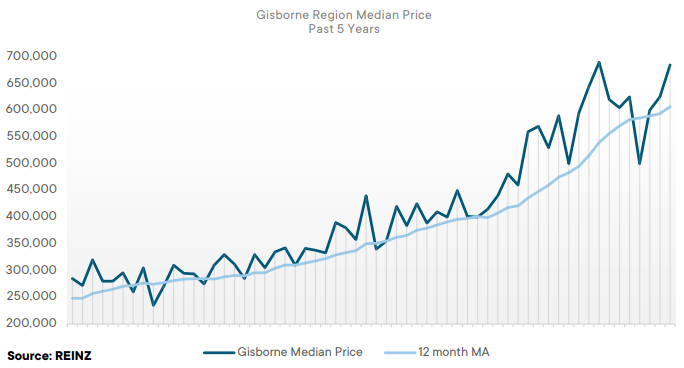
“Gisborne region’s median house price increased 29.2% year-on-year to $685,000 in November 2021. Whilst Gisborne saw an increase in inventory of 5.9% this November, the region saw an annual decrease in new listings — down 16.5%. The rise of stock on the market gives buyers more options, and as a result, there were fewer attendees at auctions.
“The number of sales by auction fell from 70.4% in November 2020 to 58.1% in 2021. Anecdotally, there was an increase of auctions being passed in and the sale negotiated after the event. The median days to sell increased by two days from 33 in November 2020 to 35 in November this year. Some expect the median days to increase further with more properties passing in at auction and other sale methods chosen over the usually popular auctions. That said, Gisborne did experience its highest sales count since March 2021, with 62 properties sold.” (REINZ)
The current Days to Sell of 35 days is less than the 10-year average for November which is 37 days. There are 8 weeks of inventory in November 2021 which is 2 weeks less than the same time last year.
Regional Analysis - Hawke's Bay
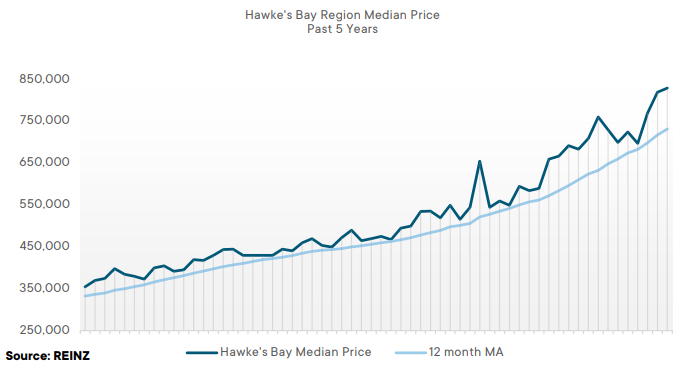
“The Hawke’s Bay region saw a record median house price in November of $830,000, up 25.8% from the same time last year. Two districts reached record median highs: Central Hawke’s Bay District ($660,000) and Napier City ($830,000). In November, Hawke’s Bay experienced a strong uplift in its inventory levels, with a 48.1% increase year-on-year. Listings were also on the rise showing a 36.3% increase. Not only this, but the region had its highest sales count since November last year with 258 properties sold. Over the next few months, this rise in activity is anticipated to continue.
“Despite some people in the market noting uncertainty around COVID-19, Hawke’s Bay has proven its resilience and demonstrated recovery following the August COVID-19 lockdown. However, a decline in investor numbers was evident due to new legislation and banks are making it difficult for a range of buyers to get finance approval.” (REINZ)
The current Days to Sell of 29 days is less than the 10-year average for November which is 36 days. There were 9 weeks of inventory in November 2021 which is 3 weeks more than the same time last year.
Regional Analysis - Taranaki
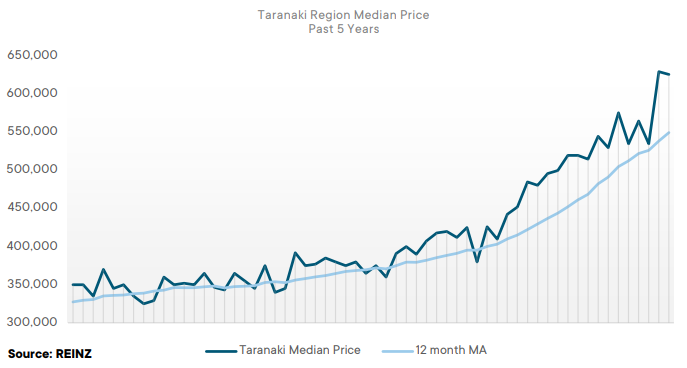
“Taranaki saw a median house price of $626,100 in November 2021, up 26.2% from November 2020. Two districts in Taranaki reached record medians: New Plymouth District ($742,000) and Stratford District ($550,000). Like many regions around the country, Taranaki saw an uplift in its inventory levels this November — up 2.3% annually. However, listings declined by 1.7% year-on-year. The Taranaki market seems to have waned slightly despite the increase in stock; some buyers have withdrawn from the market due to banks tightening their lending criteria — this is predicted to become more difficult with rising interest rates. Over the coming months, prices are expected to stay firm, but with the market tracking at a slower pace.” (REINZ)
The current Days to Sell of 28 days is less than the 10-year average for November which is 34 days. There were 7 weeks of inventory in November 2021 which is 3 weeks less than the same time last year.
Regional Analysis - Manawatu/Whanganui
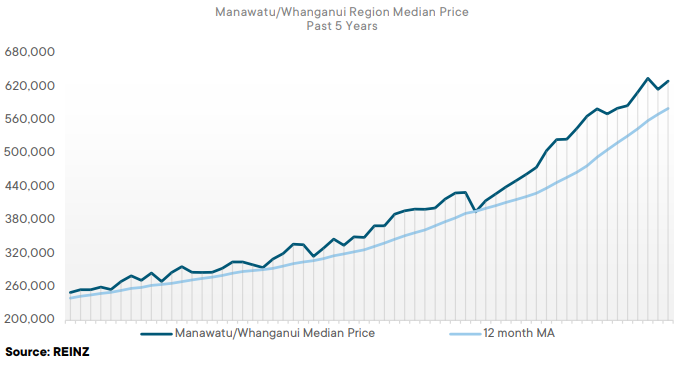
“Median house prices in the Manawatu/Whanganui region increased 24.8% from $505,000 in November 2020 to $630,000. Two districts in Manawatu/Whanganui had record medians: Ruapehu District ($465,000) and Whanganui District ($570,000). Manawatu/Whanganui has had the highest annual increase in inventory levels of all the regions in New Zealand, with a 71.4% increase this November. New listings in the region also saw a 25.1% increase year-on-year. In terms of sales count, the region saw 392 properties sold in November — its lowest November sales count since 2015, but its highest sales count since April 2021.
“The Manawatu/Whanganui market has been performing well. However, the impact of COVID-19 and new regulations are expected to hinder sales volumes over the next few months. First home buyers are struggling with the price of properties and the higher deposits required, along with the reintroduction of loan-to-value ratios. Banks are restricting their lending and some preapproved buyers have had their preapproval cancelled. As we head into the holiday period, buyer numbers may decrease further before reviving in the new year.” (REINZ)
The current Days to Sell of 30 days is less than the 10-year average for November which is 33 days. There were 10 weeks of inventory in November 2021 which is 4 weeks more than the same time last year.
Regional Analysis - Wellington
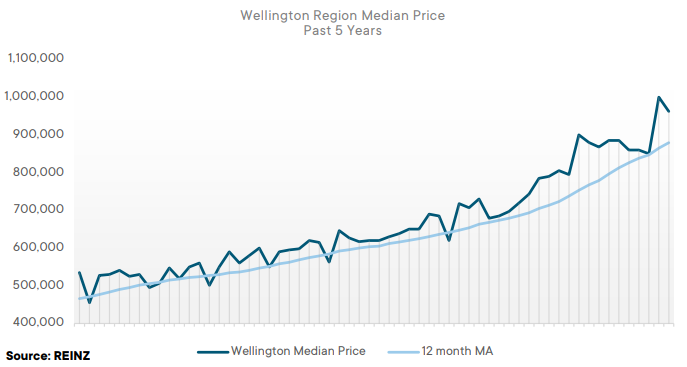
“Wellington saw its median house price reach $962,500 — up 21.8% year-on-year. Upper Hutt City reached a record high median of $928,790. Wellington’s inventory levels increased by 58.3% — from 874 in November last year to 1,384 in November 2021. Listings have also seen an uplift of 21.8%. Wellington had its highest sales count since November 2020, with 842 properties sold. Whilst the market is still on its road to recovery following the August COVID-19 lockdown, it is clear that sales and stock levels in Wellington have shown a resurgence providing buyers with more choice. As a result, properties are taking longer to sell; the median days to sell up four days from 28 days in November 2020 to 32 days in November this year. Banks are tightening their lending and making it difficult for a broad range of buyers — first home buyers, in particular, are restrained by this. When Auckland’s borders open, out of town enquiry will heighten heading into the new year.” (REINZ)
The current Days to Sell of 32 days is more than the 10-year average for November of 30 days. There were 7 weeks of inventory in November 2021 which is 1 week more than the same time last year.
Regional Analysis - Nelson/Marlborough
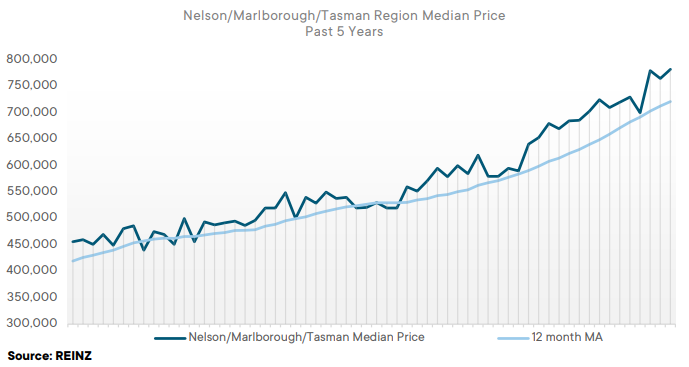
“Median prices in the Nelson, Marlborough and Tasman regions in November 2021 increased by 9.9%, 19.5% and 14.9%, respectively, from the same time last year. Both Nelson and Marlborough had an increase in stock levelsand new listings. In Nelson, new listings have been more in the mid-to-high price range, with some of the higher asking prices of vendors are being fulfilled. Properties are selling relatively fast, with the median days to sell down by one day in Nelson — from 28 days in November 2020 to 27 days in November 2021. In Marlborough, the median days to sell was unchanged from a year prior at 29 days, and in Tasman the median days to sell increased by two days from 29 to 31. Nelson had its highest sales count since November 2020 with 89 properties sold. Investors are still active in the market, but first home buyers are finding it difficult to secure finance. The desirability of Nelson, Marlborough and Tasman as summer destinations is expected to encourage further buyer interest from people in the North Island when they can travel again.” (REINZ)
The current Days to Sell of 28 days is less than the 10-year average for November which is 31 days. There were 10 weeks of inventory in November 2021 which is 1 week more than the same time last year.
Regional Analysis - West Coast
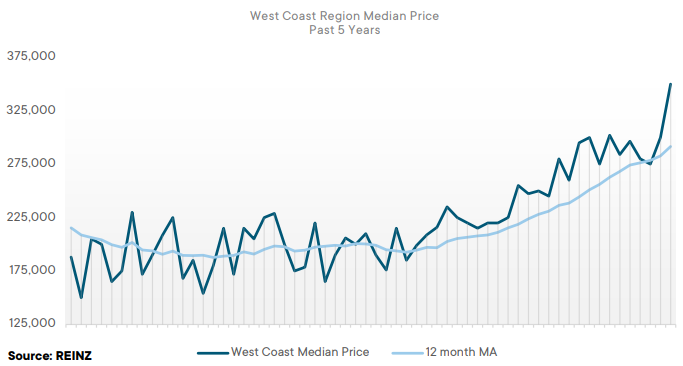
“The West Coast saw house prices increase 42.9% annually in November 2021 to $350,000 — a new record high. In addition, Buller District reached a record high median of $360,000. Buyer enquiry was high throughout November, and demand continues to outweigh supply with the West Coast experiencing a 26.2% drop in inventory levels from November 2020. Listings were also down 3.4%. Limited stock in the region has created upward pressure on prices. Negotiations for flood protections and associated building restrictions have been progressing well and provide confidence to buyers entering the market.” (REINZ)
The current Days to Sell of 35 days is much less than the 10-year average for November which is 68 days. There were 24 weeks of inventory in November 2021 which is 12 weeks less than the same time last year.
Regional Analysis - Canterbury
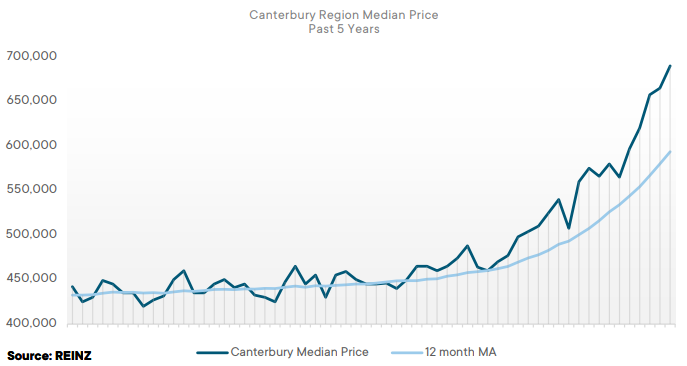
“House prices in Canterbury are rising steadily and reached a record median price in November of $690,000 — up 31.4% year-on-year — the region’s sixth consecutive record median. Three districts in Canterbury reached record median prices: Christchurch City ($700,500), Selwyn District ($870,000), and Waimakariri District ($732,000). The market in Canterbury has been steady despite a decrease in inventory levels of 18.7% and listings of 1.3%.“Buyer demand is strong, particularly for modern builds. Investors have remained conservative but active — the change in Government regulations has shifted focus in this area. Land sales are competitive and rentals around the university have proven popular. Buyers are struggling to secure finance, which has resulted in more vendors looking for cleaner offers through auctions instead of conditional offers. November saw auction sales increase significantly, with 40.9% of sales by auction in November 2021 compared to 22.3% in November 2020.
“Anecdotally, there was an increase in people downsizing and moving to outer suburbs as infrastructure and townships grow, offering outstanding lifestyle opportunities. Properties are selling fast with the median days to sell at 26 days — Canterbury’s lowest November median days to sell since 2006. The region also had its highest sales count since April 2021— with 1,176 properties sold.” (REINZ)
The current Days to Sell of 26 days is less than the 10-year average for November which is 30 days. There were 8 weeks of inventory in November 2021 which is 2 weeks less than the same time last year.
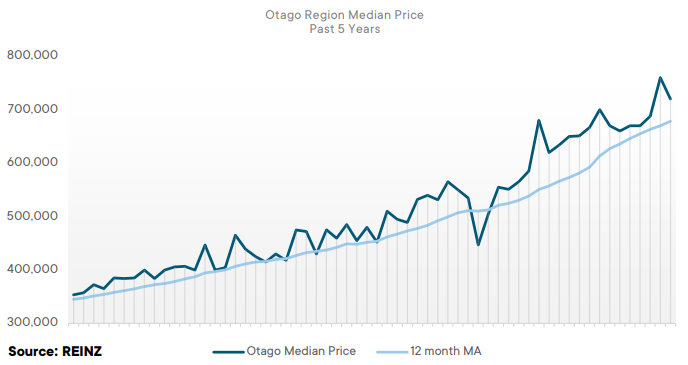
Regional Analysis - Otago
Dunedin City - “Dunedin City reached a median house price of $650,000 in November 2021 — a 9.8% increase on November 2020. An increase in listings has come onto the market and as there is greater choice for buyers, the number of attendees at open homes have decreased. The most prevalent buyers in the market presently are top end buyers who have the cash or equity which enables them to secure finance. Many investors are losing interest in existing investment properties and have instead opted for new builds due to the bright-line property rule and tax deductibility.” (REINZ)
Queenstown Lakes - “The Queenstown-Lakes District’s median house price reached $1,250,000 — an 11.6% increase year-on-year. The Wanaka Ward had a 47.5% increase year-on-year reaching $1,452,500. Owner-occupiers were the most prevalent buyers in November — many from out of town who have intentions to move to the district once borders open — this is particularly noticeable with North Islanders. Investors have started to step away from the market due to new tax deductibility rules and the challenges involved ending tenancies. Buyers from out of town continue to show interest in the Queenstown-Lakes District market, with some buying subject to viewing. With the Queenstown-Lakes District becoming a more desirable place to live, and an increase of people having the option to work remotely, it is expected that more out of town market activity will occur as borders open.” (REINZ)
The current Days to Sell of 29 days is less than the 10-year average for November which is 30 days. There were 10 weeks of inventory in November 2021 which is 1 week less than the same time last year.
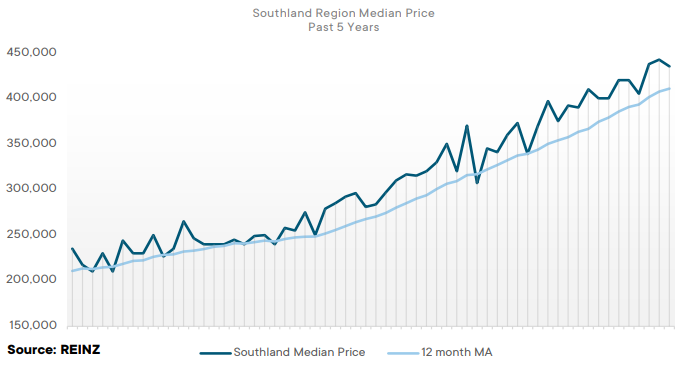
Regional Analysis - Southland
“The Southland region saw its median house price rise by 9.6% year-on-year, reaching $435,000, with Invercargill City landing a new record median of $469,000. Stock levels are slowly increasing as we near Christmas, resulting in more choices for buyers. As a result, properties spent six days longer on the market compared to last year — from 21 days in November 2020 to 27 days in November 2021. Listings have remained the same and a lower sales count than this time last year suggests a slowing market. The new legislation has impacted investors; while first home buyers have found banks are reluctant to lend. Southland reached a new high on the REINZ House Price Index of 4,591 — a 23.1% increase year-on-year.” (REINZ)
The current Days to Sell of 27 days is less than the 10-year average for November which is 29 days. There were 10 weeks of inventory in November 2021 which is 1 week more than the same time last year.
Browse
Topic
Related news
Find us
Find a Salesperson
From the top of the North through to the deep South, our salespeople are renowned for providing exceptional service because our clients deserve nothing less.
Find a Property Manager
Managing thousands of rental properties throughout provincial New Zealand, our award-winning team saves you time and money, so you can make the most of yours.
Find a branch
With a team of over 850 strong in more than 88 locations throughout provincial New Zealand, a friendly Property Brokers branch is likely to never be too far from where you are.

