Rate of growth shows signs of easing - REINZ stats July 2021
Thursday, 12 August 2021

The last two months have shown early indications that the rate of growth is starting to ease, however, it is too early to say whether this is the usual winter easing we would normally see or if the Government’s intervention in the market and signalled changes to the OCR are starting to take effect. (REINZ).
Median prices for residential property across New Zealand increased by 25.2% from $659,500 in July 2020 to a record $826,000 in July 2021, according to the latest data from the Real Estate Institute of New Zealand (REINZ), source of the most complete and accurate real estate data in New Zealand.
Jen Baird, Chief Executive at REINZ says: “House prices have continued to rise across the country as every region saw a year-on-year increase from July 2020. The last two months have shown early indications that the rate of growth is starting to ease, however, it is too early to say whether this is the usual winter easing we would normally see or if the Government’s intervention in the market and signalled changes to the OCR are starting to take effect."
“The strength of the market has again been reflected in the REINZ House Price Index which reached a new high on the index nationally. Every region across New Zealand reached a record level in July, indicating the underlying value of property is holding strong and will likely do so for a few months yet,” continues Baird.
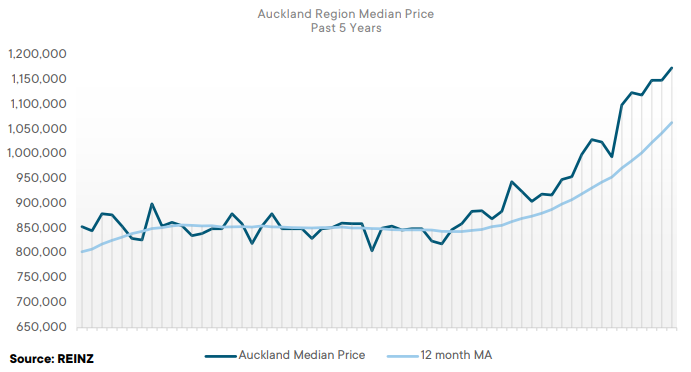
“Looking at Auckland, we’ve seen another record median price, the ninth record in the last 12 months – this growth is spread across the region with six of the seven districts reaching new record median prices in July,” she continues.
Regions with the largest increase in annual sales volumes during July were:
- Northland:+7.8% (from 218 to 235 – 17 more houses) – the highest for a July month since 2016
- Gisborne: +70.6% (from 34 to 58 – 24 more houses) – the highest for a July month since 2016.
- Nelson: -50.0% (from 124 to 62 – 62 fewer houses) – the lowest for a July month since 2014
- Tasman: -30.5% (from 95 to 66 – 29 fewer houses)
- Hawke’s Bay: -28.4% (from 282 to 202– 80 fewer houses) – the lowest for a July month since 2014.
Regional Analysis - Auckland
“The Auckland region reached a new record median house price of $1,175,000 in July – a 28.0% increase compared to July 2020. Six out of the seven districts in Auckland also reached record median prices in July: Franklin District ($885,000), Manukau City ($1,075,000), North Shore City ($1,375,000), Papakura District ($913,000), Rodney District ($1,240,000), and Waitakere City ($1,100,000). First home buyers have been active in the Auckland market; however, the number of properties being sold under the $750,000 price mark continue to decline with only 14.9% being sold within this price band in July compared to 28.5% at the same time last year.
“The Auckland region reached a new record median house price of $1,175,000 in July – a 28.0% increase compared to July 2020. Six out of the seven districts in Auckland also reached record median prices in July: Franklin District ($885,000), Manukau City ($1,075,000), North Shore City ($1,375,000), Papakura District ($913,000), Rodney District ($1,240,000), and Waitakere City ($1,100,000). First home buyers have been active in the Auckland market; however, the number of properties being sold under the $750,000 price mark continue to decline with only 14.9% being sold within this price band in July compared to 28.5% at the same time last year.
The current Days to Sell of 32 days is less than the 10-year average for July which is 37 days. There were 9 weeks of inventory in July 2021 which is 13 weeks less than the same time last year.
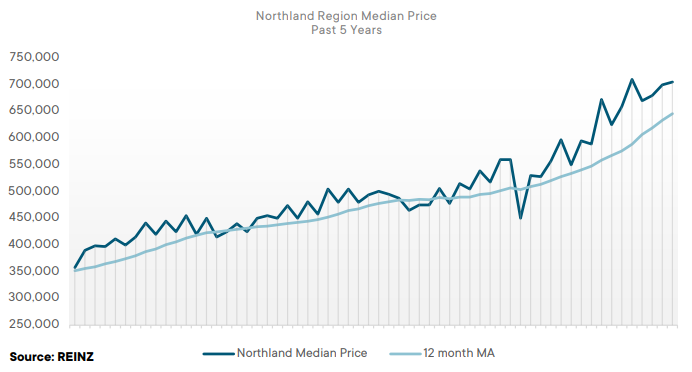
Regional Analysis - Northland
“Median house prices in the Northland region saw a 26.6% increase when compared to the same time last year, reaching $705,000. This corresponds with an increase in the properties being sold in the $750,000-$1 million price bracket – up 10.7 percentage points to 22.6% in July 2020. Northland has experienced a 7.8% increase in sales volumes, from 218 to 235 – the highest for a July month since 2016. As we usually see in the winter months, there has been a decrease in stock levels with new listings down 24.2% and overall inventory down 53.6% year-on-year to the lowest level on record for the region.
Vendors are holding off from listing their property for sale until they have another one secured, which is adding to the shortage of stock in the region. Auctions have held their place as a method of sale with 15.3% of properties being sold under the hammer in July 2021, up from 6.9% at the same time last year. First home buyers are having some difficulty securing finance. The REINZ House Price Index for Northland reached a new record level of 3,869, up 25.1% year-on- year.” (REINZ)
The current Days to Sell of 43 days is much less than the 10-year average for July which is 59 days. There were 11 weeks of inventory in July 2021 which is 33 weeks less than the same time last year.
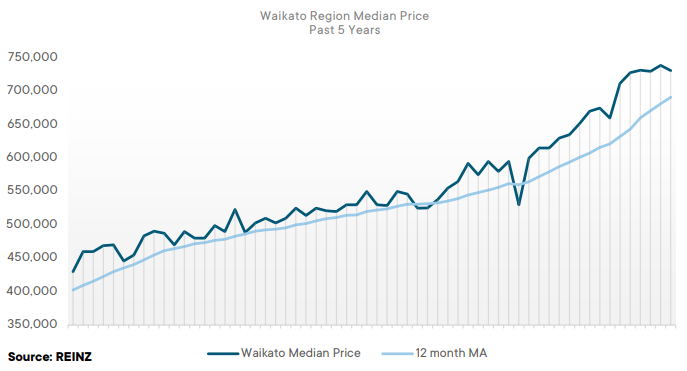
Regional Analysis - Waikato
“The Waikato region saw median house prices increase 18.9% year-on-year to $731,000. Two Waikato districts saw record median house prices; Waikato District ($790,000) and Waitomo District ($480,000), both exceeding their previous records of last month. The REINZ House Price Index for Waikato also reached a new high of 4,325, which is a 32.4% increase from July 2020. The number of properties available for sale decreased 42.7% year-on-year, resulting in significant demand-side pressure. More listings are expected to come to the market over the next few months as we move into spring.
First home buyer activity remains steady and lending criteria is sufficient. The Waikato region saw 52.3% of properties sold for less than $750,000 in July, down from 71.4% the in July 2020. There were fewer investors in the market in July as they take a wait and see approach with the new housing policies. There has been a steady increase of properties being sold under the hammer with 21.9% of properties sold by auction in July, a total of 160 sales. Properties continue to sell quickly in the Waikato region with a median days to sell of 28 – the lowest for a July month since records began.” (REINZ)
The current Days to Sell of 28 days is much less than the 10-year average for July which is 45 days. There were 7 weeks of inventory in July 2021 which is 10 weeks less than the same time last year.
Regional Analysis - Bay of Plenty
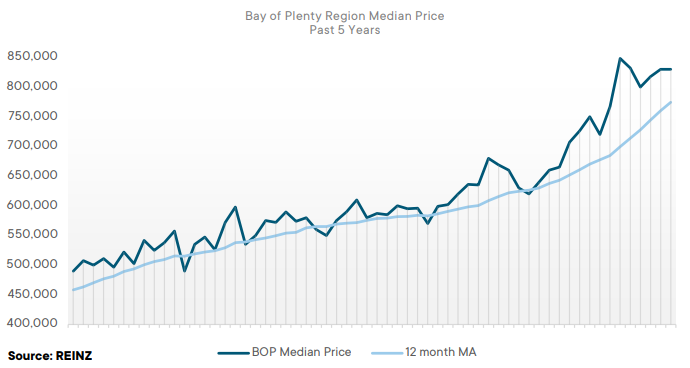
“The Bay of Plenty region saw median house prices reach $830,000, the same median for last month but an increase of 25.8% year-on-year. First home buyer activity has remained steady; however, bank lending remains the longest part of the process. More properties are now being sold for $1 million or more, making up 31.4% of all sales in July, up from 14.5% of all sales in July 2020.
Inventory remains low with a total of 676 properties available to prospective purchasers, placing upward pressure on prices as demand continues to outweigh supply. Median days to sell is the same as last month (31) but has decreased from 40 days at the same time last year – this is the lowest median number of days to sell for a July month since records began. The REINZ House Price Index for the Bay of Plenty region increased 34.0% annually to a new record level of 4,046. Listings are expected to increase over the coming months as we approach spring and the warmer months.” (REINZ)
The current Days to Sell of 31 days is much less than the 10-year average for July which is 50 days. There were 7 weeks of inventory in July 2021 which is 10 weeks less than the same time last year.
Regional Analysis - Gisborne
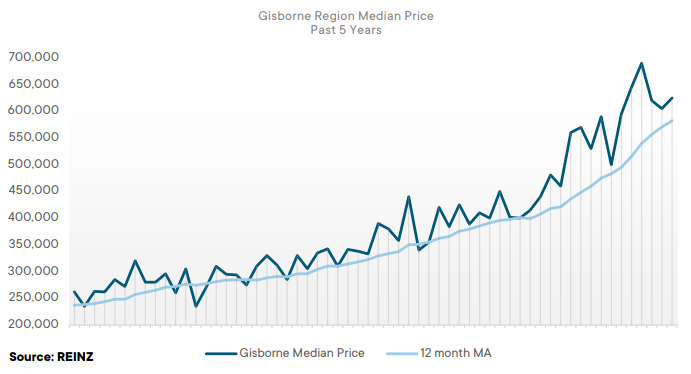
“Gisborne saw a median house price of $625,000 in July, up 30.0% on the same time last year. Sales volumes have increased in the region by 70.6% (from 34 to 58) – the highest for a July month since 2016. July saw a 20% increase in the number of properties available to prospective purchasers, with 60 available properties up from 50 in July 2020. Similar to last month, Gisborne is the only region to experience an increase in inventory, now sitting at 8 weeks. Properties are spending less time on the market with a median of 35 days to sell, down from 37 in July 2020.
First home buyers have been active in the market this month although not securing as many properties due to the time it takes to secure finance and complete due diligence. Gisborne continues to see an increase of sales by auction with 53.4% of sales (31 properties) sold under the hammer, up from 47.1% (16 properties) in 2020.” (REINZ)
The current Days to Sell of 35 days is less than the 10-year average for July which is 43 days. There are 8 weeks of inventory in July 2021 which is 1 week more than the same time last year.
Regional Analysis - Hawke's Bay
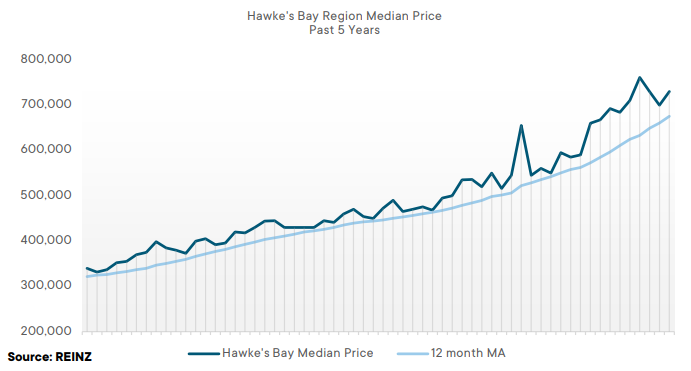
“In July, Hawke’s Bay saw the median house price increase to $730,000, a 32.7% rise up from $550,000 in July 2020. Median house prices are expected to continue in an upward trend with the 46.0% of properties being sold in excess of $750,000 in July 2021, up from 24.1% in July 2020. The number of properties sold decreased 28.4% in July 2021 with 202 properties sold, compared to 282 properties in July 2020 – the lowest number of properties sold in a July month since 2014. Owner-occupiers have been active in the market, looking to upgrade their property.
First home buyers are still active in the market, although at a slightly lower level than previous months. There is a shortage of properties available for sale in the market with 6 weeks of total inventory available to prospective purchasers (253 properties down from 440 year-on-year). People are preparing to list their properties in spring, so an increase in listings and inventory is expected in the warmer months.” (REINZ)
The current Days to Sell of 31 days is less than the 10-year average for July which is 38 days. There were 6 weeks of inventory in July 2021 which is 6 weeks less than the same time last year.
Regional Analysis - Taranaki
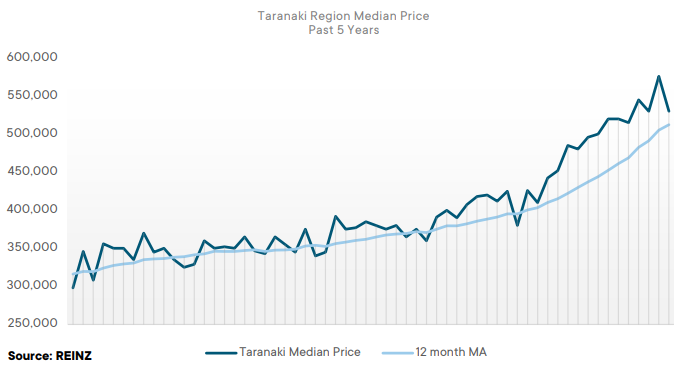
"Taranaki saw a median house price of $530,000 in July, up 19.8% year-on-year. The South Taranaki District had a record median price of $435,000, exceeding its previous record of $420,000 set in May 2021. Buyer enquiry is strong for the region, as demand continues to outweigh supply. The number of properties available for sale in the Taranaki region decreased 4.9% annually leaving just 6 weeks of stock available to prospective purchasers (220 properties). Properties sold for less than $750,000 made up 75.8% of the market in July, down from 90.0% of the market in July 2020, leaving buyers with fewer options at the lower end of the market.
Investors have remained active in the market, although at a lower level than previous months as they take a wait and see approach after the recent legislative changes. The shortage of supply continues to place upward pressure on prices across the region. Taranaki’s market has been fast-paced with a median of 28 days to sell, up from 25 days at the same time last year.” (REINZ)
The current Days to Sell of 28 days is much less than the 10-year average for July which is 46 days. There were 6 weeks of inventory in July 2021 which is 6 weeks less than the same time last year.
Regional Analysis - Manawatu/Whanganui
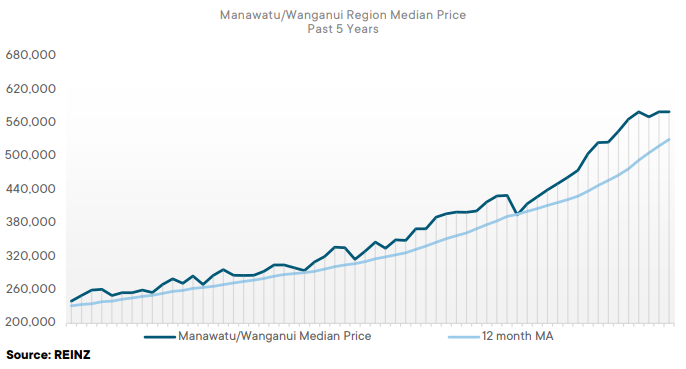
“Median house prices in the Manawatu/Whanganui region achieved a record equal $580,000 in July 2021. Additionally, four districts in Manawatu/Whanganui reached median price records including Manawatu District ($629,000), Palmerston North City ($678,000), Rangitikei District ($520,000), and Tararua District ($445,000). July saw a decrease in the proportion of properties sold in the sub-$500,000 price bracket, making up 29.6% of sales in the region, down from 62.5% of sales in July 2020.
First home buyers have taken a small step back from the market as they take a wait and see approach around the latest government initiatives. 348 properties sold across the region in July, down 21.4% annually to the lowest level we have seen for the month of July since 2015. As we are seeing across the country, Manawatu/Whanganui is also experiencing a shortage of available properties with 8 weeks of stock available (a total of 490 properties), down 15.5% year-on-year. Investors have also taken a slight step back in July as they wait to see what impact the various government initiatives will have. The REINZ House Price Index for Manawatu/Whanganui increased 48.5% to a new record high of 5,051 in July – the highest annual percentage increase across all regions in New Zealand.” (REINZ)
The current Days to Sell of 32 days is much less than the 10-year average for July which is 42 days. There were 8 weeks of inventory in July 2021 which is 2 weeks less than the same time last year.
Regional Analysis - Wellington
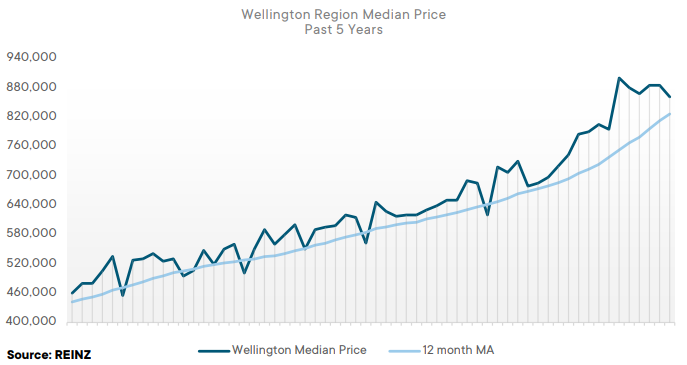
“In July, Wellington saw median house prices increase 23.6% year-on-year to $861,500, from $696,800 at the same time last year. The REINZ House Price Index for Wellington reached a record level of 4,164, up 39.9% from July 2020. July saw fewer properties coming to the market than the same time last year, with new listings down 6.6%. The total number of properties available to prospective purchasers decreased 13.7% annually, leaving 727 properties, down from 842 properties at the same time last year. The shortage of inventory continues to place upward pressure on house prices. Median days to sell increased slightly from 29 days in July 2020 to 32 days in July 2021. First home buyers and investors are taking more of a wait and see approach in the lead up to spring, where we expect more listings to come to the market. A total of 604 properties were sold in July, down 23.2% from 786 properties in July 2020.” (REINZ)
The current Days to Sell of 32 days is less than the 10-year average for July of 37 days. There were 5 weeks of inventory in July 2021 which is 5 weeks less than the same time last year.
Regional Analysis - Nelson/Marlborough
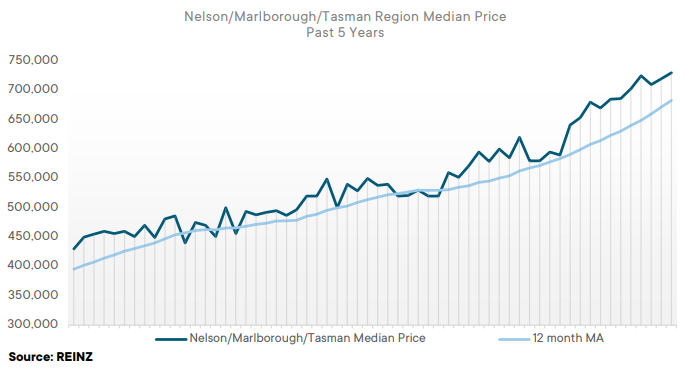
“Nelson region saw a 17.2% increase in median house prices year-on-year to $688,000; Marlborough saw a 41.5% increase year-on-year of $672,000; and Tasman saw a 21.3% increase year-on-year to a median house price of $825,000. Properties in Tasman have sold at the fastest rate of any region in New Zealand, with the median number of days to sell at 25 – the lowest for a July month since 2007. The REINZ House Price Index for Nelson/Marlborough/Tasman reached a record level of 3,189 up 27.0% year-on-year.
The number of properties available to prospective purchasers has remained low across the regions with Nelson down 53.5% year-on-year to 166 properties, the lowest level since records began. The number of properties sold in the $1 million-plus price bracket increased from 5.2% of the market in July 2020, to 16.4% of the market in July 2021. People are starting to see the benefits these regions have to offer including employment opportunities and an attractive lifestyle, which is evident by the increase in out-of-town buyers that we are starting to see moving into the Nelson/ Marlborough/Tasman regions.” (REINZ)
The current Days to Sell of 27 days is less than the 10-year average for July which is 35 days. There were 8 weeks of inventory in July 2021 which is 14 weeks less than the same time last year.
Regional Analysis - West Coast
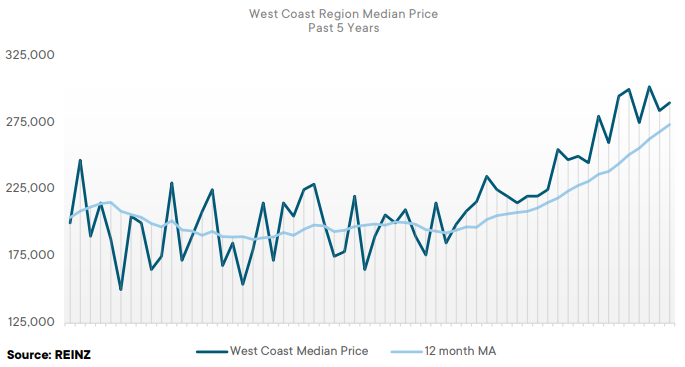
“The West Coast region saw a 28.9% increase in median prices year-on-year, reaching $290,000 in July. Grey District reached a record median house price of $281,000, beating its prior record of $280,000 set in March 2021. Purchasers remain active and interested in the region, the number of properties sold was down 7.4% annually, from 54 properties in July 2020 to 50 in July 2021.
The number of properties available to prospective purchasers decreased 47.3% year-on-year to 137 properties – the lowest level of inventory since records began in 2007. The number of properties sold for less than $250,000 decreased from 55.6% of all sales in July last year, to 32.0% of all sales in July 2021. Properties are selling quickly in the West Coast region, with median days to sell at 31 days, down from 56 days in July 2020 – the lowest for a July month since records began.” (REINZ)
The current Days to Sell of 31 days is much less than the 10-year average for July which is 75 days. There were 14 weeks of inventory in July 2021 which is 29 weeks less than the same time last year.
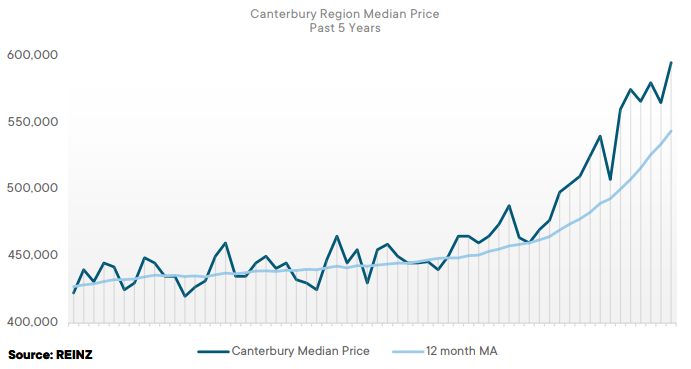
Regional Analysis - Canterbury
“Canterbury saw median house prices reach a record $595,000 in July, up 24.7% from the same time last year. Four districts within Canterbury experienced record median house prices in July, including Ashburton District ($458,000), Selwyn District ($740,000), Timaru District ($460,000), and Waimakariri District ($620,000). Buyer activity is expected to scale up across the region as we head into the warmer months. Canterbury saw a 48.6% decrease in the total number of properties available to prospective purchasers with 1,303 properties in July, down from 2,535 in July 2020 – the lowest level of inventory since records began. Sales volumes were also down 8.1% from 1,052 in July 2020 to 967 in July 2021.
Properties on the market are selling quicker than the same time last year at a median 28 days to sell, down from 34 days – the lowest for a July month since 2007. On the ground, first home buyer activity remains steady as international travel has been removed as an option, and young working professionals are instead using their savings to invest in property. Auctions remain a popular method of sale in Canterbury with 31.2% of properties sold under the hammer in July.” (REINZ)
The current Days to Sell of 28 days is less than the 10-year average for July which is 35 days. There were 6 weeks of inventory in July 2021 which is 11 weeks less than the same time last year.
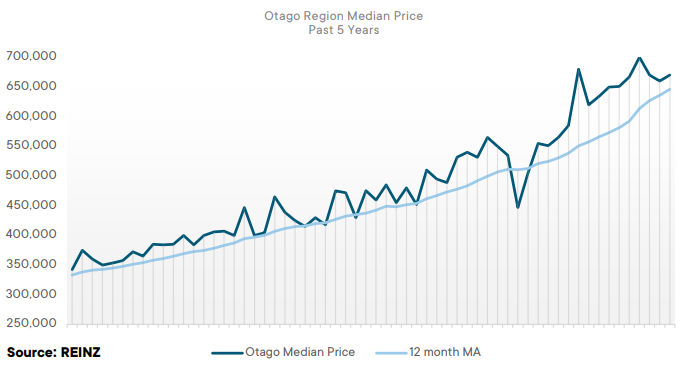
Regional Analysis - Otago
Dunedin City - “Median house prices in Dunedin increased 26.3% year-on-year to $650,000 in July 2021 – a record median price, exceeding the previous record of $636,000 set in May 2021. The median days to sell for Dunedin sat at 25 days in July, down from 28 the same time last year. The number of properties sold in July decreased from 201 in July 2020 to 129. First home buyers are still active in the market. Supply for the district is tight which is continuing to have an upward influence on prices. More properties are expected to come to the market over the coming months as we approach spring.” (REINZ)
Queenstown Lakes - “Queenstown-Lakes median house price decreased slightly in July 2021, down 4.5% year-on-year from $1,100,000 in July 2020 to $1,050,000. However, the median sale price in Wanaka increased 4.5% annually to $1,150,000 in July 2021. Sales volumes have remained strong in the Queenstown-Lakes district through the winter months and activity is expected to remain steady into spring. Interest from out-of-town purchasers has remained high, particularly from Auckland and Christchurch. Low levels of new listings are coming to the market, resulting in low levels of overall inventory, placing pressure on the market. Available properties are selling quickly with median days to sell down 8 days annually from 52 days in July 2020 to 44 days in July 2021.” (REINZ)
The current Days to Sell of 33 days is less than the 10-year average for July which is 38 days. There were 9 weeks of inventory in July 2021 which is 3 weeks less than the same time last year.
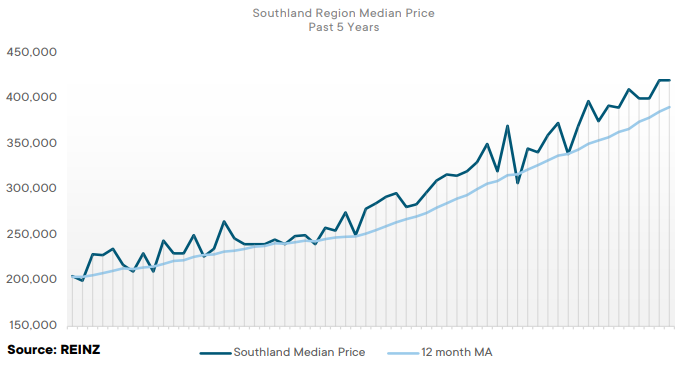
Regional Analysis - Southland
“The median house price in Southland increased 16.7% annually to a record equal $420,000 in July 2021, 156 properties were sold during July, down 16.6% year-on-year – this was the lowest number of properties sold for a July month since 2017. These low levels of sales are likely due to the fact that there are fewer properties available – the number of properties available to prospective purchasers decreased 41.4% year-on-year to a record low level of 219.
Investors have been less active in the market during July as they take a wait and see approach to the recent legislative changes. 67.9% of properties sold during July were in the sub-$500,000 bracket, down from 85.0% in July 2020 – leaving fewer properties available at the low end of the market. Activity levels, including new listings, are expected to increase in the coming months as we approach spring and the warmer months.” (REINZ)
The current Days to Sell of 34 days is much less than the 10-year average for July which is 38 days. There were 8 weeks of inventory in July 2021 which is 6 weeks less than the same time last year.