Total pool of properties available for sale in NZ falls to record lows - REINZ stats January 2021
Tuesday, 16 February 2021

Despite most New Zealanders taking a summer holiday in January, the housing market was busier and more buoyant than we would usually see at this time of year, according to the latest data from the Real Estate Institute of New Zealand (REINZ).
Median house prices across New Zealand increased by 19.3% from $612,000 in January 2020 to $730,300 in January 2021. While median prices were down marginally from December, house prices held up better than we would normally expect when moving from December to January as indicated by REINZ’s seasonally adjusted median pricing data which showed a 2.0% lift.
For New Zealand excluding Auckland, the number of properties sold decreased by 10.3% when compared to the same time last year (from 3,443 to 3,087) – the lowest for the month of January for 7 years and the first annual decrease in 8 months.
Bindi Norwell, Chief Executive at REINZ says: “Usually, in January the residential property market slows down, and prices ease off a bit as people head to the beach for their summer holidays. However, the first month of 2021 was anything but normal, as house prices across the country have continued to rise with January seeing four regions reach new record median prices and one region equal its December record. Furthermore, 27 districts around the country reached new record high median prices, with 13 of those districts exceeding last month’s record.
“Additionally, the fear of future price rises and the fear of missing out lingers deep in buyers’ minds and is impacting people’s buying behavior as January saw a continuation of properties selling at a rapid pace. Last month, residential properties sold at their fastest pace for a January month in 17 years, carrying on the pattern we’ve seen over the past few months and therefore continuing to impact pricing.” continues Norwell.
Regions with the largest increase in annual sales volumes during January were:
- West Coast: +54.1% (from 37 to 57 – 20 more houses) – the highest for the month of January in 15 yearsBOP: 23.9% increase from $726,500 in October 2020 to a new record of $900,000 in October 2021.
- Southland: +18.4% (from 114 to 35 – 21 more houses)Taranaki: 31.1% increase from $480,500 in October 2020 to a new record of $630,000 in October 2021.
- Gisborne: +7.7% (from 26 to 28 – 2 more houses)
- Canterbury: +6.4% (from 708 to 753 – 45 more houses) - the highest for the month of January in 14 years
- Northland: +3.8% (from 158 to 164 – 6 more houses) – the highest for the month of January in 5 years
- Waikato: +2.8% (from 493 to 507 – 14 more houses) – the highest for the month of January in 5 years
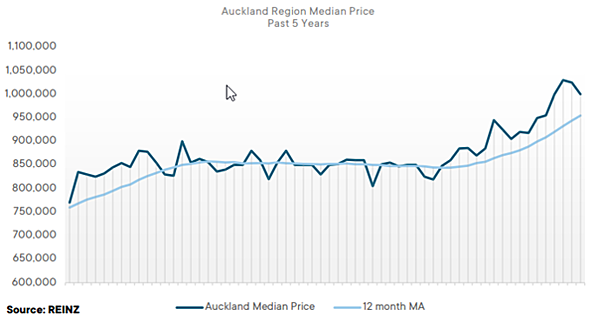
Regional Analysis - Auckland
“Median house prices in Auckland increased 14.9% year-on-year to $1,000,000 in January 2021, up from $870,000 in January 2020. The fear of missing out continues to be a factor in the increased volume of sales as January saw a 37.6% increase from the same time last year, with owner-occupiers and investors acting quickly before LVR restrictions are reinstated in March this year. Buyers continue to be a mix of first home buyers, investors and owner occupiers with no particular segment of the market standing out which means the market is in a balanced position.
The increased sales volume activity has resulted in busier open homes and the speed at which properties are selling has remained low for this time of the year. New developments across the region have added to the stock level, contributing to the 37.4% increase in listings and has meant that only a slight decrease in total inventory levels from the same time last year. The REINZ House Price Index for Auckland increased 17.7% year-on-year, showing the strength of the underlying value of property in the region.” (REINZ)
The current Days to Sell of 35 days is less than the 10-year average for January which is 40 days. There were 10 weeks of inventory in January 2021 which is 8 weeks less than the same time last year.
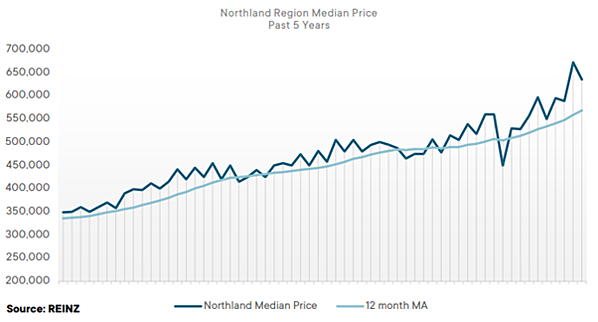
Regional Analysis - Northland
“The Northland region saw interest in the housing market build quickly after the holiday break with median house prices increasing 22.6% year-on-year in January 2021 to $635,000 from $518,000 in January 2020. The market remained busy with a 3.8% increase in sales volumes when compared to the same time last year and was the highest level of sales for a January month in 5 years. Bank approvals continue to be slow. Demand has remained high from owner-occupiers and investors, with an increase in interest from out-of-town investors as they look to the regions for more affordable options.
Properties are selling more quickly than usual with the median number of days to sell the lowest for a January month on record at 44 days (down from 59 days in January 2020). Inventory levels are still low; however, we expect this to pick over the coming months.” (REINZ)
The current Days to Sell of 44 days is much less than the 10-year average for January which is 57 days. There were 15 weeks of inventory in January 2021 which is 22 weeks less than the same time last year.
Regional Analysis - Waikato
“The Waikato property market has been busier this January than compared to the holiday period last year. Median house prices increased 10.1% when compared to January last year to $655,000. With no easing of demand, prices have continued to climb, and we’ve seen this with record median house prices in the South Waikato District ($450,000) and the Thames-Coromandel District ($864,700). First home buyers are remaining active in the market and have used the holiday period as a great time to get into the market as others go on holiday, however, many are still finding it difficult competing with investors. Open homes have continued to be busy and auctions have proven to be a popular method of sale, with 9.1% of all properties sold via auction in January, up from 1.7% at the same time last year.
Properties are selling quick, as the median number of days to sell decreased 17 days from the same time last year to 32 days – the lowest for a January month on record. Currently sales volumes are not too dissimilar to the number of new listings coming onto the market suggesting that if more listings don’t come onto the market soon this will start to impact volumes going forward." (REINZ)
The current Days to Sell of 32 days is much less than the 10-year average for January which is 48 days. There were 8 weeks of inventory in January 2021 which is 7 weeks less than the same time last year.

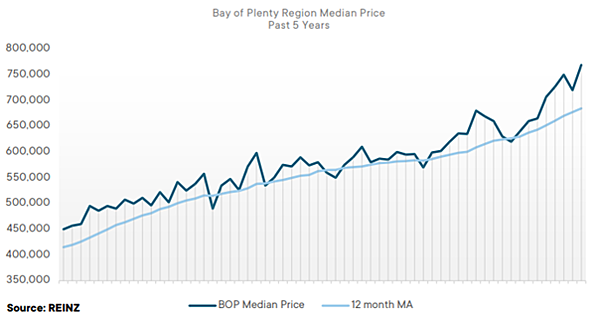
Regional Analysis - Bay of Plenty
“The Bay of Plenty region reached a record high median house price of $769,000 in January 2021, up 13.1% year-on-year from $680,000 in January 2020. Four of the six districts within the Bay of Plenty region also reached record median house prices: Kawerau District ($367,000), Rotorua District ($600,000), Tauranga City ($854,000) and Western Bay of Plenty District ($793,500). Ongoing demand and competition between first time buyers, owner-occupiers and investors continues to drive prices higher and push sales through quicker with days to sell down 11 days year-on-year to the lowest level for a January month on record.
The REINZ House Price Index for Bay of Plenty increased 22.1% in January 2021 from the same time last year to a record high level of 3,595, further displaying the underlying strength of property values in the Bay of Plenty region.” (REINZ)
The current Days to Sell of 40 days is much less than the 10-year average for January which is 55 days. There were 7 weeks of inventory in January 2021 which is 5 weeks less than the same time last year.
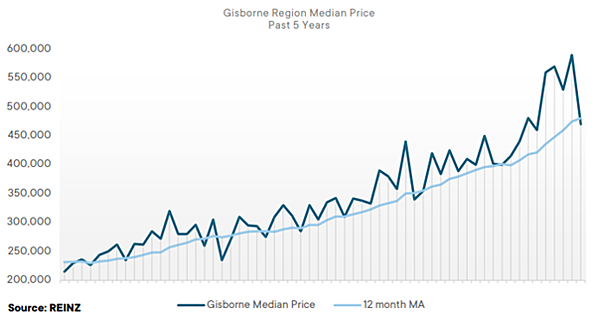
Regional Analysis - Gisborne
“Median house prices in Gisborne increased 17.5% year-on year to $470,000 in January with the percentage of sales over the $750,000 mark continuing to grow. The market continues to be strong with sales volumes increasing 7.7% year-on-year. First time buyers are still active in the market, as are investors, although they appear to be slowing down a little due to the new RTA regulations.
The REINZ House Price Index for Gisborne/Hawke’s Bay increased 30.7% annually in January 2021 to a record high of 4,012, the first time since June 2004 that the region has had an annual movement in excess of 30%. Looking forward we expect the market to continue in a similar fashion until the issues of supply can be addressed.” (REINZ)
The current Days to Sell of 37 days is less than the 10-year average for January which is 46 days. There are 7 weeks of inventory in January 2021 which is 7 weeks less than the same time last year.
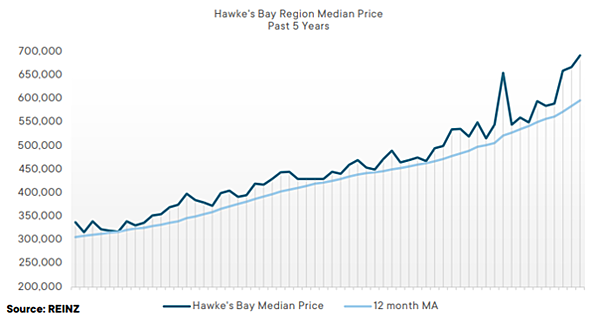
Regional Analysis - Hawke's Bay
“Hawke’s Bay reached a record median house price of $692,500 in January 2021, up 25.9% from the same time last year ($550,000) and vendor expectations for pricing continue to remain high. The Central Hawke’s Bay District ($590,000), Napier City ($770,000) and Wairoa District ($621,000) all reached record median prices in January. Demand is still high across the region with many properties selling with multi-offers. However, access to finance continues to be a barrier for some purchasers as banks are taking longer with approvals and some individuals are having to apply for time extensions. Properties sold in the million-dollar-plus bracket increased from 3.6% of the market in January 2020 to 10.2% of the market in January 2021.
The REINZ House Price Index for Gisborne/Hawke’s Bay increased 30.7% annually in January 2021 to a record high of 4,012, the first time since June 2004 that the region has had an annual movement in excess of 30%.” (REINZ)
The current Days to Sell of 28 days is much less than the 10-year average for January which is 46 days. There were 6 weeks of inventory in January 2021 which is 4 weeks less than the same time last year.
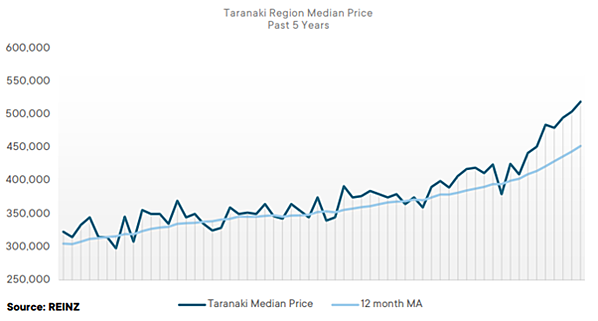
Regional Analysis - Taranaki
“Taranaki reached a new record median house price in January of $520,000, up 23.8% from January 2020 ($420,000). Demand for good properties in the low-to-middle price range has remained strong, with many first home buyers looking to get on the ladder although they are struggling to find affordable properties given the rate that house prices have risen of late. Low interest rates have encouraged more investors back into the market, although this trend may not last too long, given the upcoming reintroduction of LVRs.
Supply continues to be an issue for the region, with inventory down 23.0% year-on-year, leaving 5 weeks’ of available stock, the second lowest level across the country and the lowest level Taranaki has ever had on record. The REINZ House Price Index for the region increased 20.5% annually to a record level of 3,843.” (REINZ)
The current Days to Sell of 24 days is much less than the 10-year average for January which is 46 days. There were 5 weeks of inventory in January 2021 which is 11 weeks less than the same time last year.
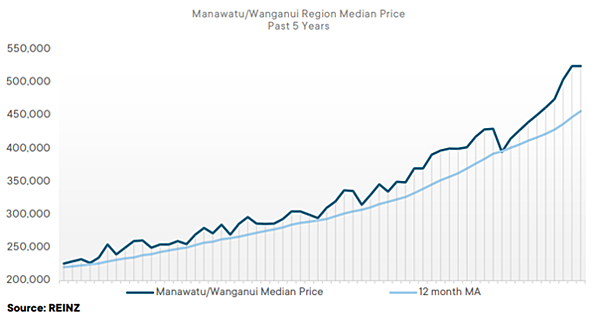
Regional Analysis - Manawatu/Whanganui
"Manawatu/Wanganui reached a record equal median house price of $525,000 in January 2021, the same as December 2020 and up 25.6% annually. First home buyers have been very active in the market as they compete to secure a property amongst the increasing level of investors who have entered the market recently. Supply continues to be tight in the region, with 4 weeks of inventory available to purchasers, the lowest it has had on record (the previous low was 5 weeks).
The lack of supply has meant that most properties are receiving multiple offers, some as many as 25, and vendor expectations are increasing with asking prices up 13.8% year-on-year to an average of $517,926. This level of activity is expected to continue over the coming months, however, the upcoming reintroduction of the LVRs may change this for investors.” (REINZ)
The current Days to Sell of 30 days is much less than the 10-year average for January which is 45 days. There were 4 weeks of inventory in January 2021 which is 7 weeks less than the same time last year.
Regional Analysis - Wellington
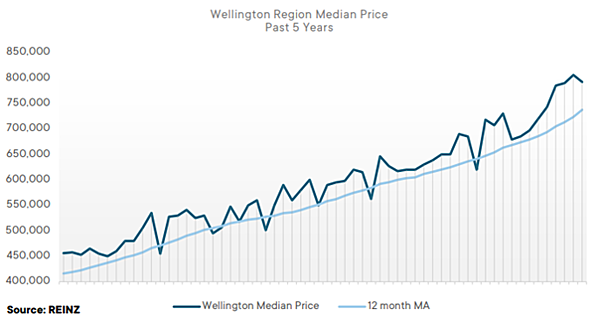
“Median house prices in Wellington increased 27.7% year-on-year to $792,000 in January 2021, up from $620,000 in January 2020. Record median house prices were reached in Carterton District ($700,000), Kapiti Coast District ($860,000), Lower Hutt City ($800,000) and Upper Hutt City ($799,000) highlighting how much pressure there is on parts of the Wellington region currently. The percentage of properties sold for $1 million or more, increased from 9.9% of all properties in January 2020, to 19.7% of all properties in January 2021. The REINZ House Price Index indicated a 26.0% year-on-year increase to a record level of 3,717 – which was the largest annual HPI movement for Wellington on record. Sales volumes were down -31.0% annually for the region, to the lowest level of January sales since records began – in part due to the very low levels of inventory the region is experiencing, which is down 16.2% annually, leaving 7 weeks of available stock to potential purchasers.
Properties are still selling quickly, as Wellington’s median days to sell are down 1 day from the same time last year, to 37 days, the lowest January days to sell in 14 years. Looking forward over the next couple of months, we would expect the market to remain steady – although if new listings don’t continue to come onto the market this could mean lower sales volumes in the future.” (REINZ)
The current Days to Sell of 37 days is less than the 10-year average for January of 44 days. There were 7 weeks of inventory in January 2021 which is 1 week less than the same time last year.
Regional Analysis - Nelson/Marlborough
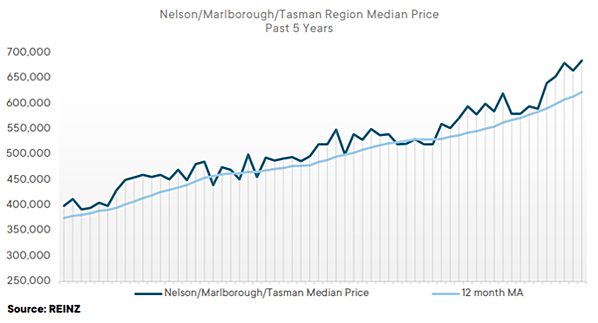
“The Nelson/Marlborough/Tasman region saw an increase in median house prices, with Nelson experiencing a new record of $712,500. On the other hand, sales volumes decreased across the region, particularly in Marlborough by 45.8% year-on-year, its lowest January sales count in 10 years. Tasman also had its lowest January sales count in 21 years (35 sales). First home buyers are still active; however, they are finding it hard to meet the increasing prices. There have been some purchasers who have transferred to the region due to good employment opportunities as well as the interest in the lifestyle of the region. Vendor expectations are high given the lack of availability of listings on the market.
Auctions are becoming more popular; however, deadline sales are still the preferred method. Properties in the lower to mid-range continue to be experiencing multi offers. Overall, listings are tight, so activity is focused on new listings as they come onto the market.” (REINZ)
The current Days to Sell of 33 days is less than the 10-year average for January which is 42 days. There were 10 weeks of inventory in January 2021 which is 5 weeks less than the same time last year.
Regional Analysis - West Coast
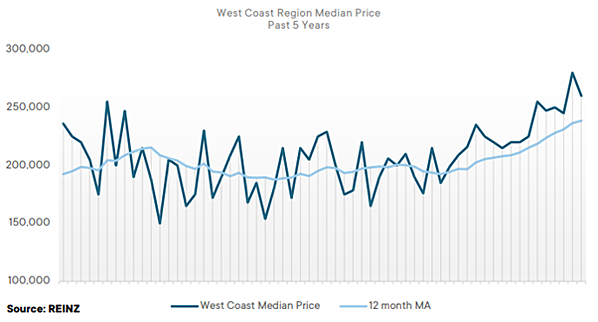
“Median house prices in the West Coast increased 10.6% in January 2021, compared to the same time last year, reaching $260,000. The market was very busy for a January month with sales volumes increasing 54.1% from 37 in January 2020 to 57 in January 2021. Days to sell decreased 8 days to 25 days, one of only three regions to see days to sell less than 30 days, and its lowest January median days to sell in 17 years. Overall, the market continues to be active with increased buyer demand and interest from investors.
Multi-offers are becoming more prevalent with the increased lack of listings in the region. One recent sale of a duplex investment property sold at 30% over the appraised value. It will be interesting to see how things go over the coming months, especially with the offers that have been presented recently, something the West Coast is not used to seeing.” (REINZ)
The current Days to Sell of 25 days is much less than the 10-year average for January which is 65 days. There were 21 weeks of inventory in January 2021 which is 170 weeks less than the same time last year.
Regional Analysis - Canterbury
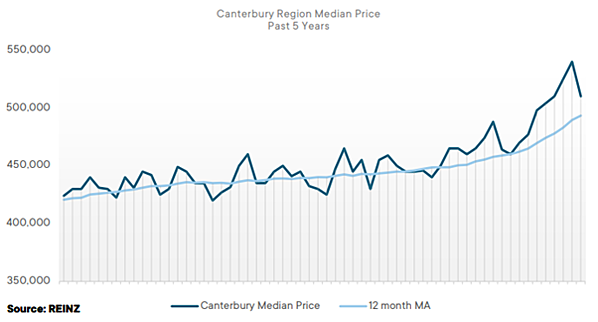
“Median house prices in Canterbury increased 9.7% year-on-year, reaching $510,000 in January and the Selwyn District saw a new record median price of $619,000 and the Timaru District saw a new record median price of $426,000. Sales also increased 6.4% with 753 sales of which 57 went to auction. Additionally, the region had its highest January sales count in 14 years. The REINZ House Price Index saw a new high of 2,908, a 15.7% annual increase, showing the continued strength of the region. First home buyers make up a large percentage of the buyer pool with a number of open homes seeing more than 50 groups of potential purchasers through the property. Investors also continue to be active in the market.
Overall buyer demand continues to be driven by low interest rates, the lack of available listings and a desire to get onto the market before prices increase further. The market is likely to continue to perform similarly over the coming months and is not expected to slow down for a while yet.” (REINZ)
The current Days to Sell of 33 days is less than the 10-year average for January which is 41 days. There were 6 weeks of inventory in January 2021 which is 11 weeks less than the same time last year.
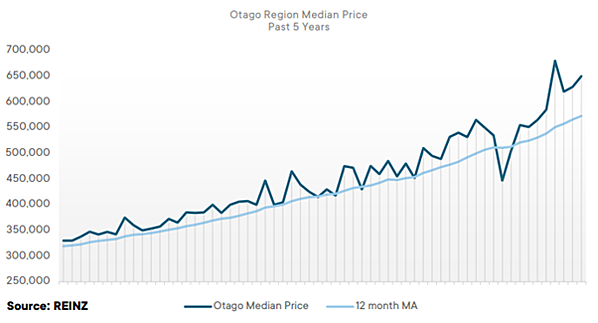
Regional Analysis - Otago
“The Queenstown Lakes District saw a 7.6% decrease in median house prices from $1,055,000 in January 2020, down to $975,000 in January 2021. However, sales volumes increased 44.9% annually with 71 properties sold in January 2021. There is considerable buyer interest with open homes staying busy and plenty of enquiries from local purchasers, out-of-towners and some international interest from returning Kiwis. It is difficult to predict what may happen over the coming months with listings continuing to be tight, the upcoming return of LVRs and the wider moves by the government to slow the market.” (REINZ)
“Dunedin City reached a new record median house price of $618,000 in January 2021, up 12.8% year-on-year from $548,000 in January 2020. First home buyers are very active in the market. Stock levels continue to be tight, meaning there is strong competition for purchasers from investors, who are still prevalent in the market and in a rush to buy before the new LVRs come into place. Vendor expectations have been high, as it is clear that the lack of stock has caused further imbalance between supply and demand.” (REINZ)
The current Days to Sell of 37 days is less than the 10-year average for January which is 44 days. There were 8 weeks of inventory in January 2021 which is 7 weeks less than the same time last year.
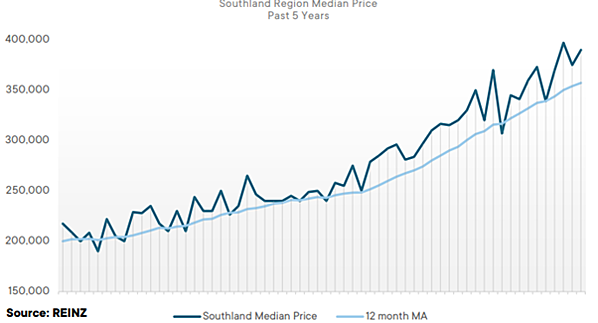
Regional Analysis - Southland
“The Southland region saw median house prices increase 11.4% annually in January 2021 to $390,000, up from $350,000 in January 2020. January always tends to be a slower month for the region; however, sales volumes were up 18.4% year-on-year with 135 properties sold. Investor activity has been on the rise again as the future of the Tiwai Point smelter has been confirmed for another few years, removing some doubt for purchasers.
The reintroduction of LVRs may slow this investor activity again, however, this may be countered by the increasing number of Kiwi expats moving south upon their return. Inventory is getting tighter for the region as stock decreases to 8 weeks available to potential purchasers, down from 12 weeks at the same time last year.” (REINZ)
The current Days to Sell of 34 days is less than the 10-year average for January which is 43 days. There were 8 weeks of inventory in January 2021 which is 4 weeks less than the same time last year.